



A note on methodology. Figures in this month’s edition use data pulled on 9 November and differ from our Outlook pulled on 26 October. Later October arrivals change some on-time figures by 1-2 percentage points. Global on-time arrivals are now at 24%, a lower reading than the 25% in late October. Far East to Europe also shifted slightly to 7% from 5% on-time, due to an increase in on-time arrivals in the final week of the month.
Less than a quarter of global vessels arrive on-time and Gemini’s lead disappears on Asian trades
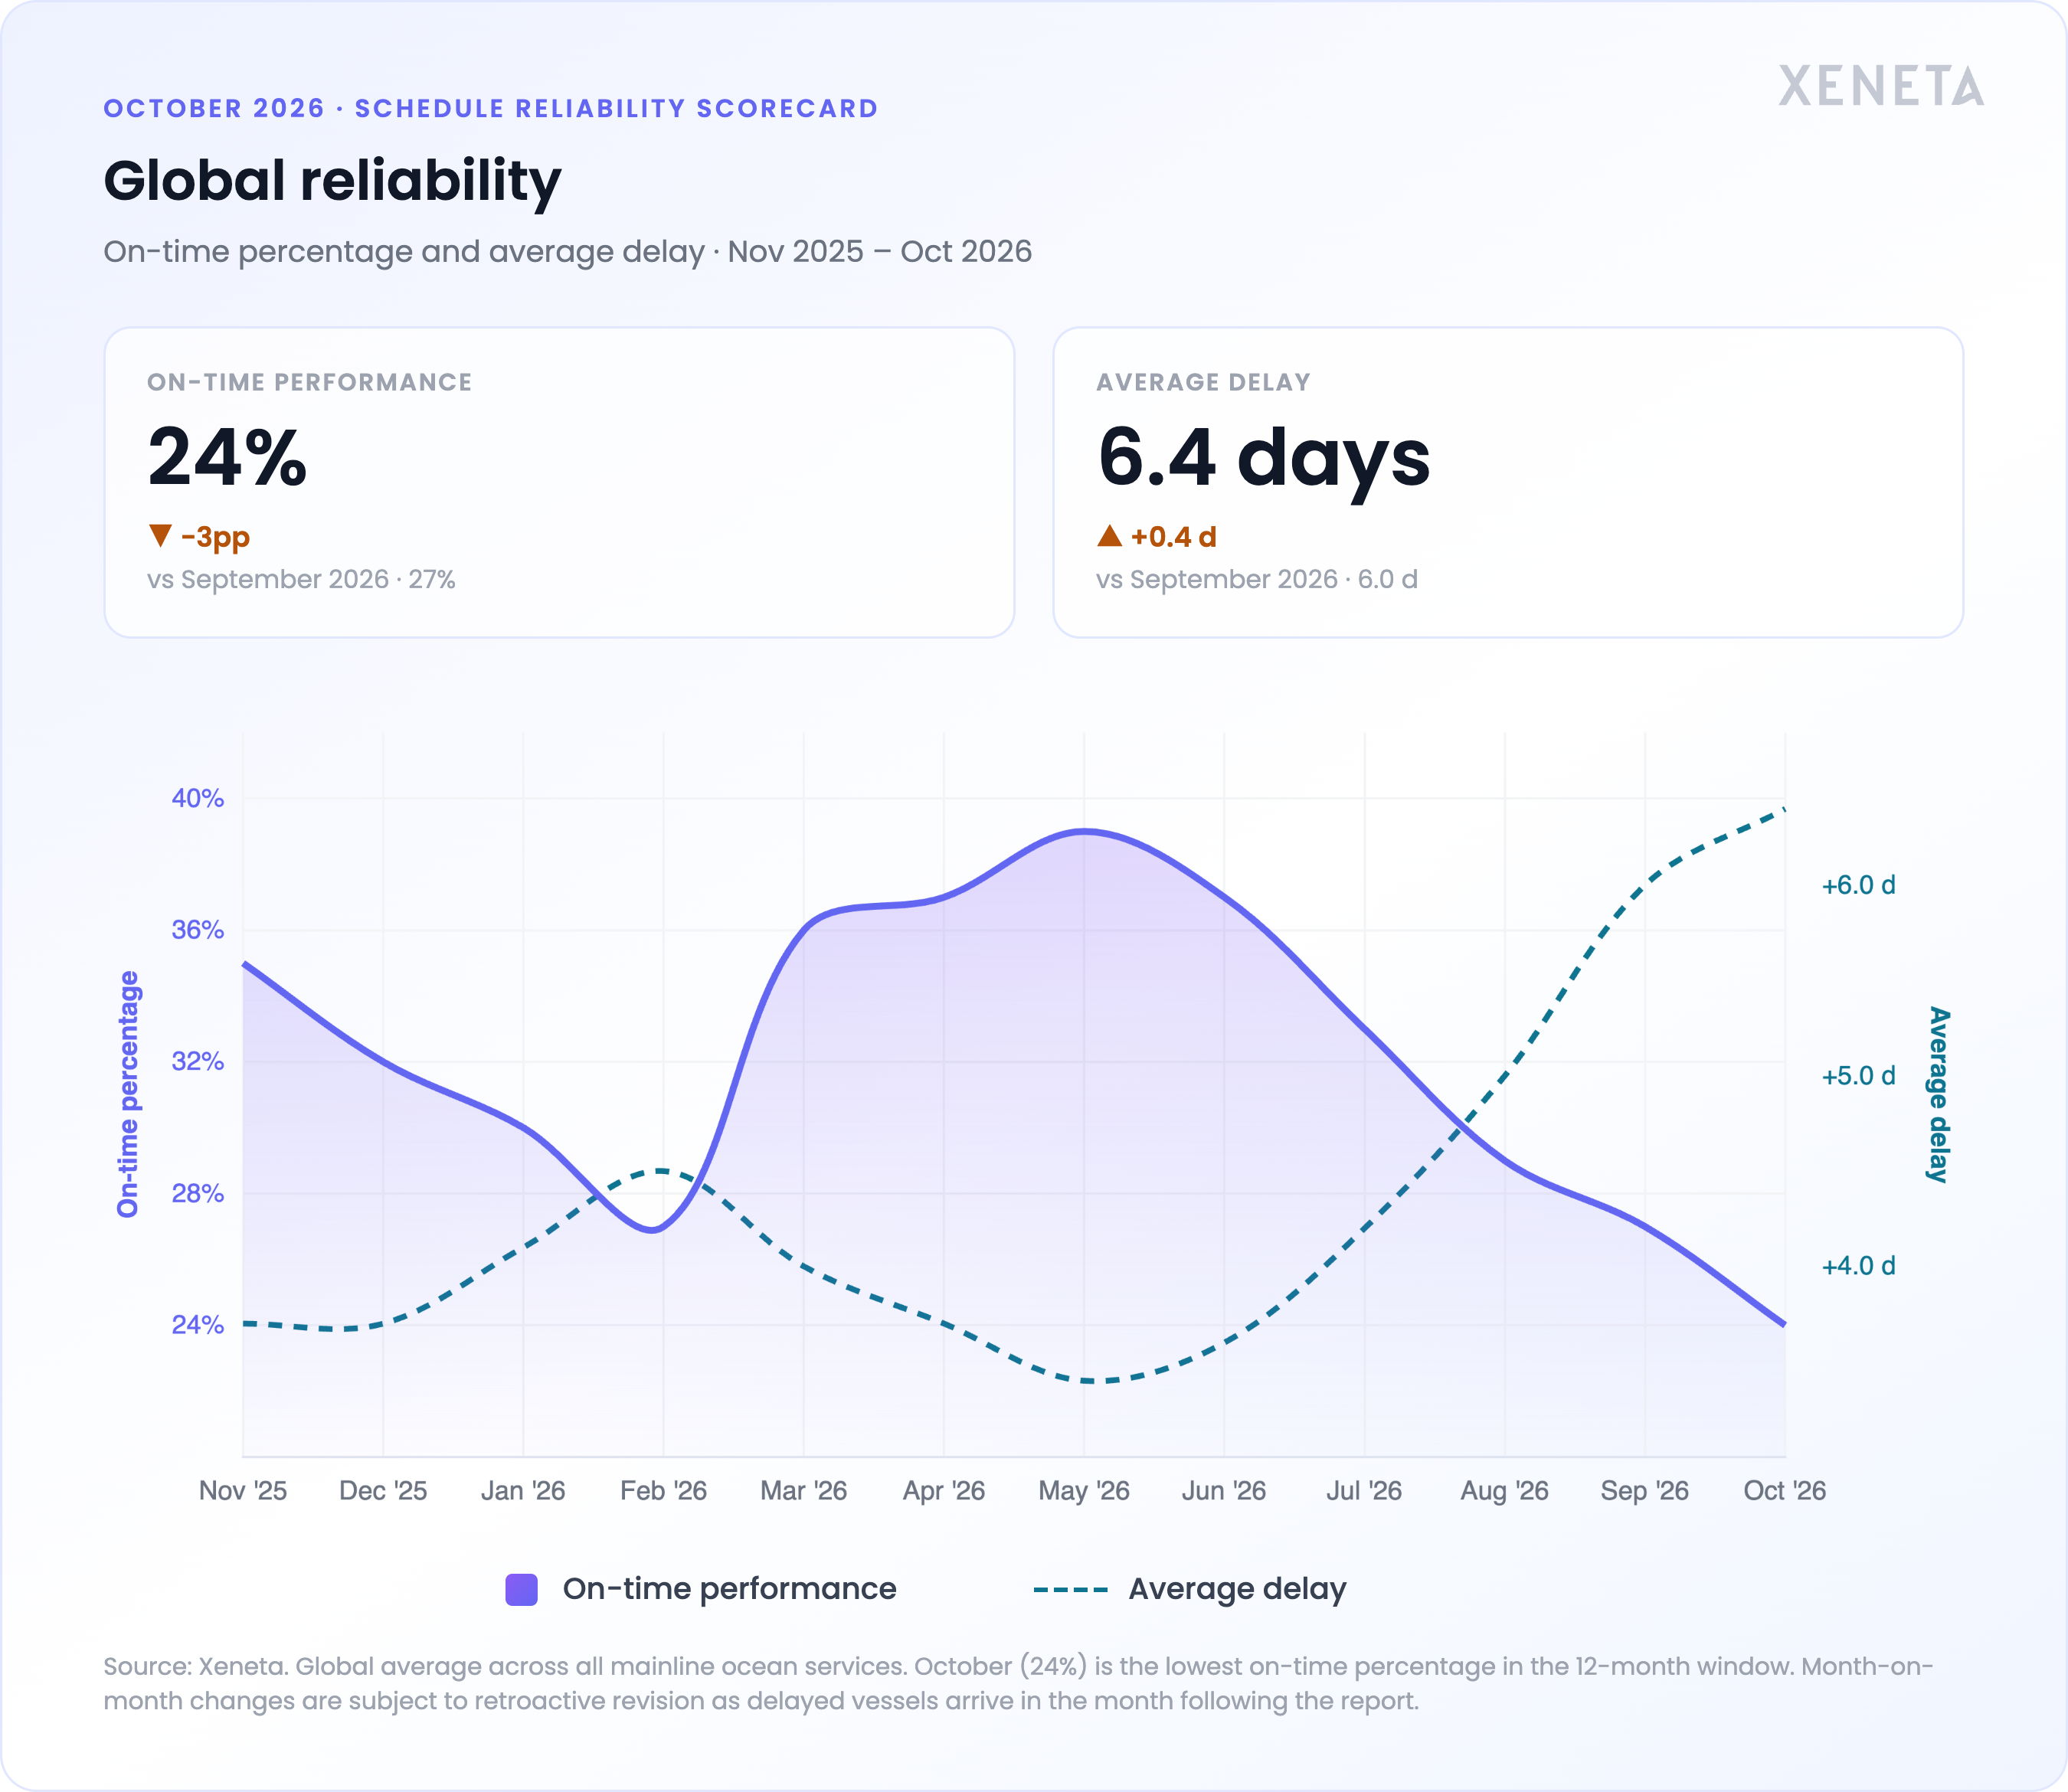
Global on-time arrivals declined for a fifth consecutive month to 24% in October, 3pp below September and now at their lowest monthly average since July 2022. Average delay picked up another 0.4 days, now at +6.4 days across all arrivals. The pace of the fall picked up some speed against the 2pp decline from August to September, and reversing this trend will be an uphill battle.
Trades: The Middle East sets a historic low with 12% on-time and Far East to Europe stays near the floor
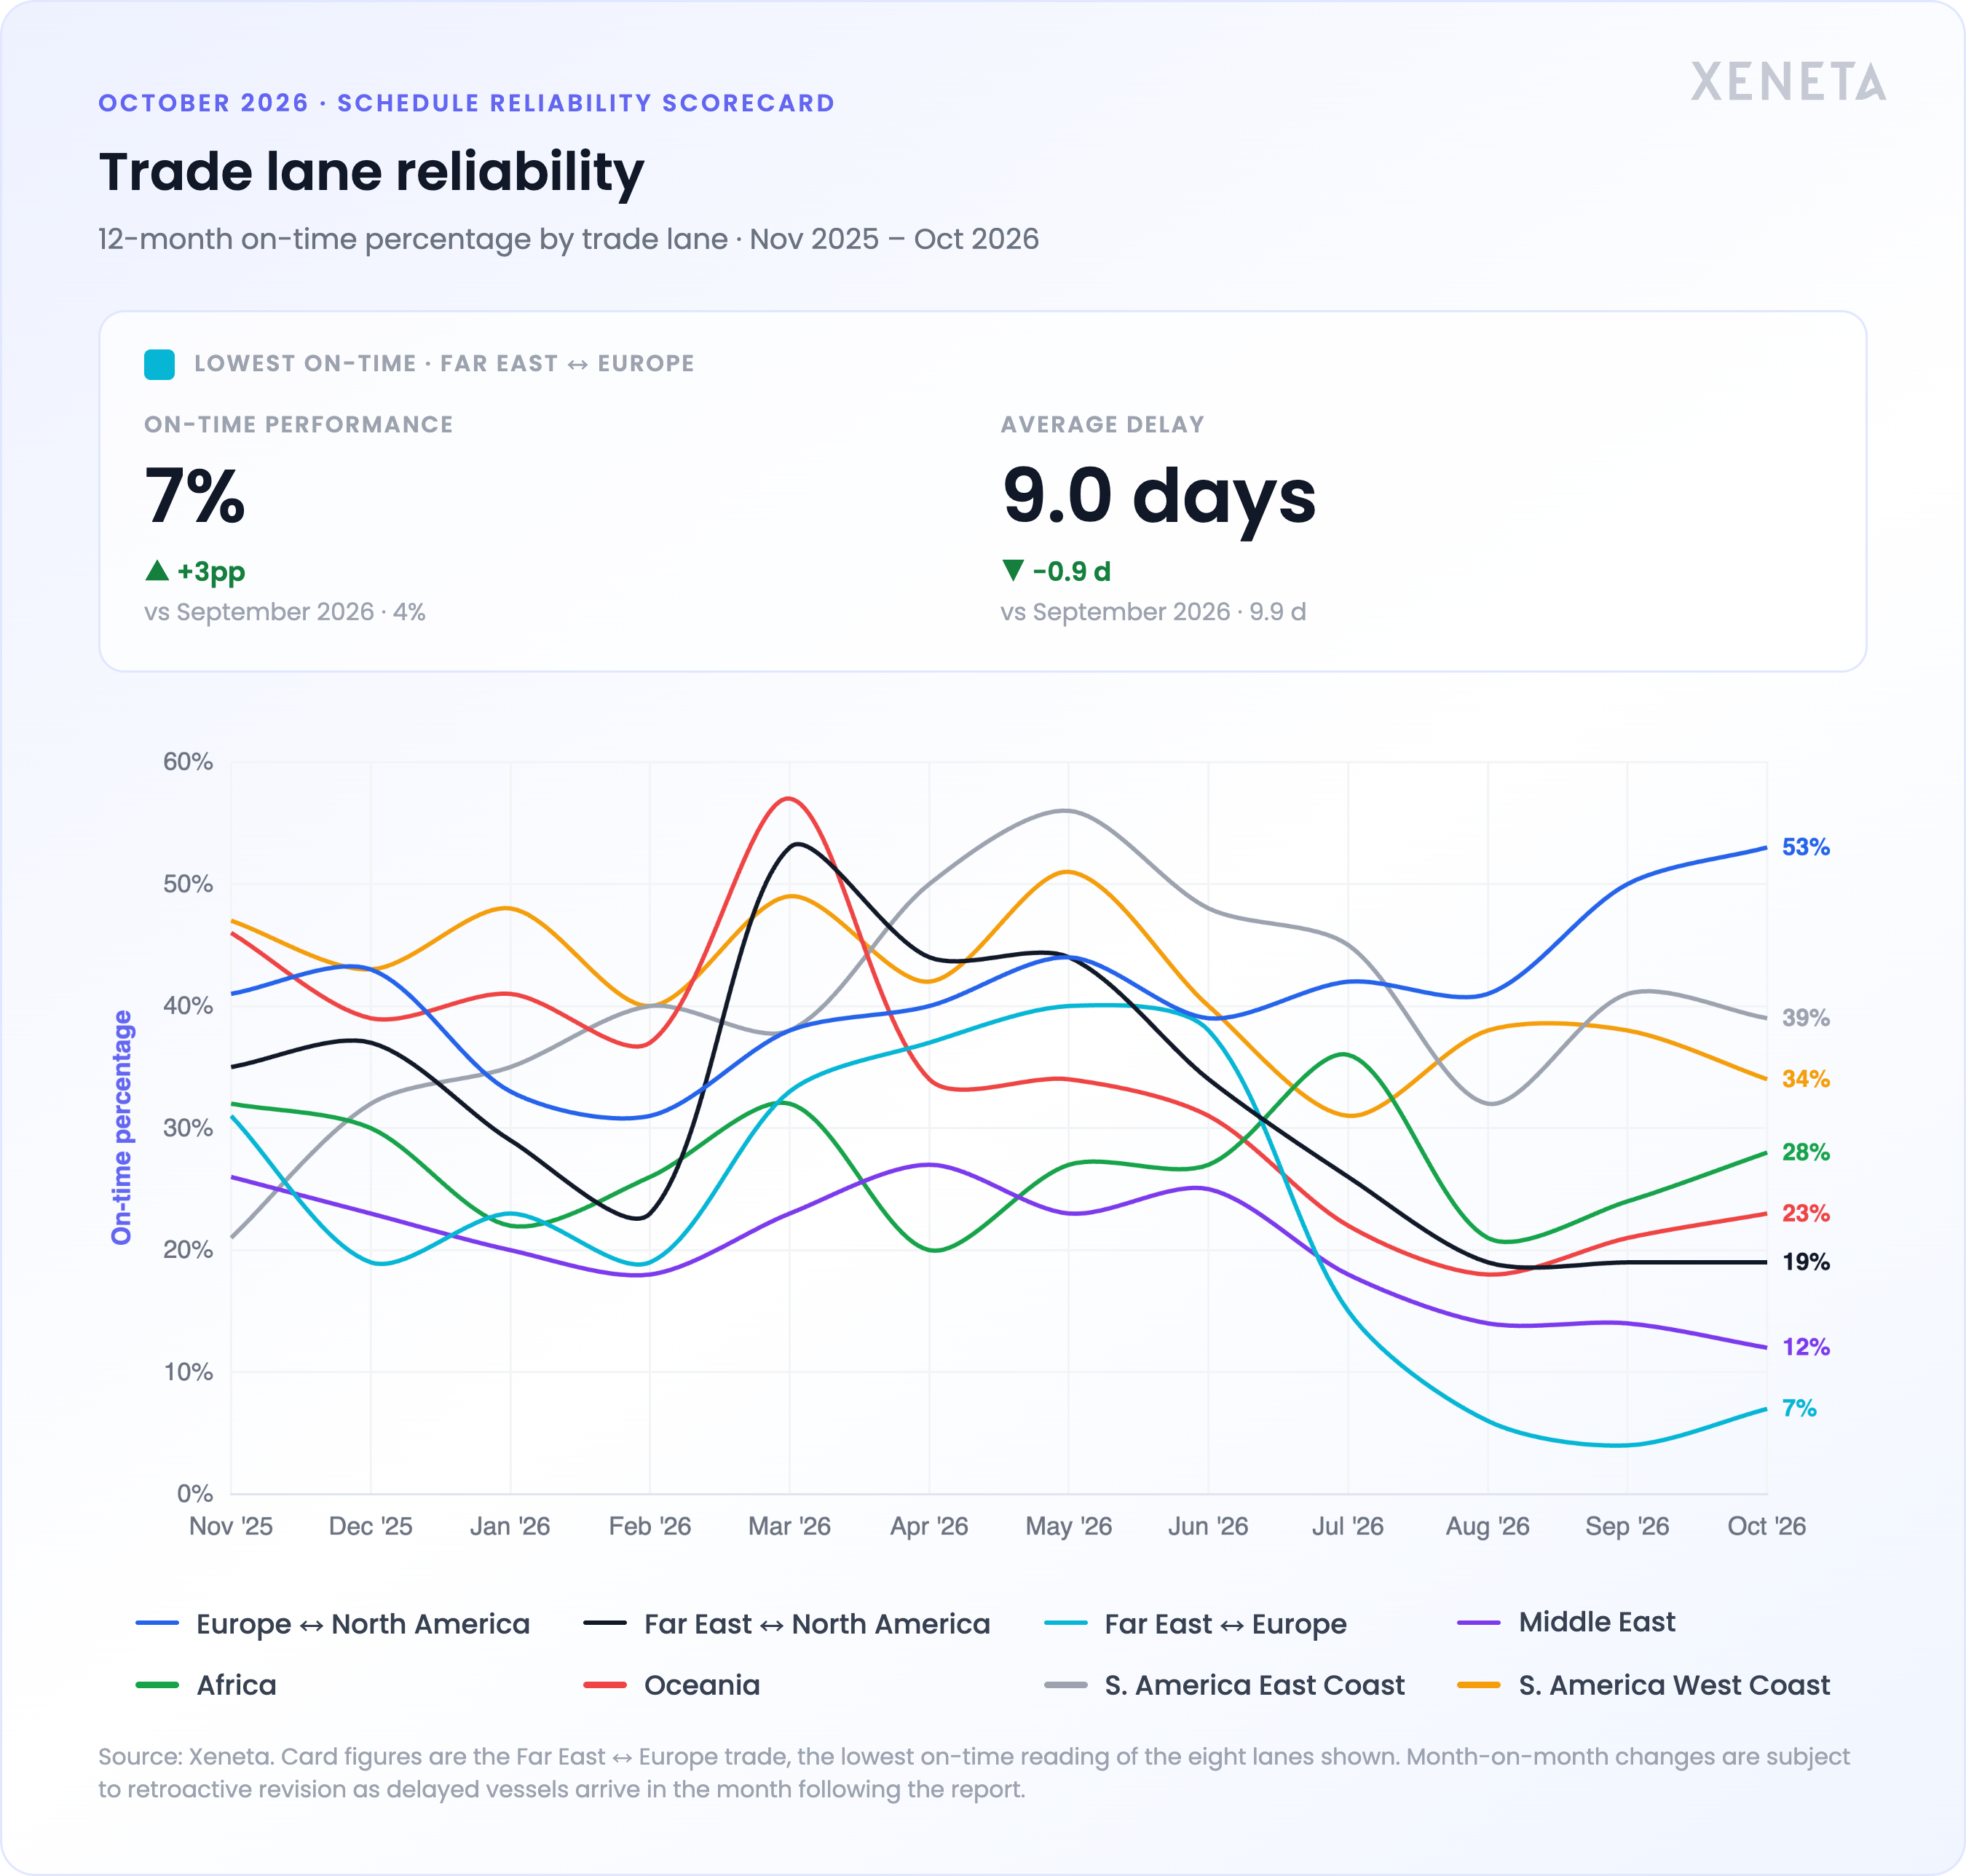
Far East to Europe improved ever so modestly by 3pp up to 7% on-time in October and scaled average delays back to 9.0 days. Far East to North America held flat at 19% on-time and delays eased to 6.3 days. Asia-dependent trades continue to struggle, with minimal gains against low baselines making a recovery above 25% unlikely before 2027.
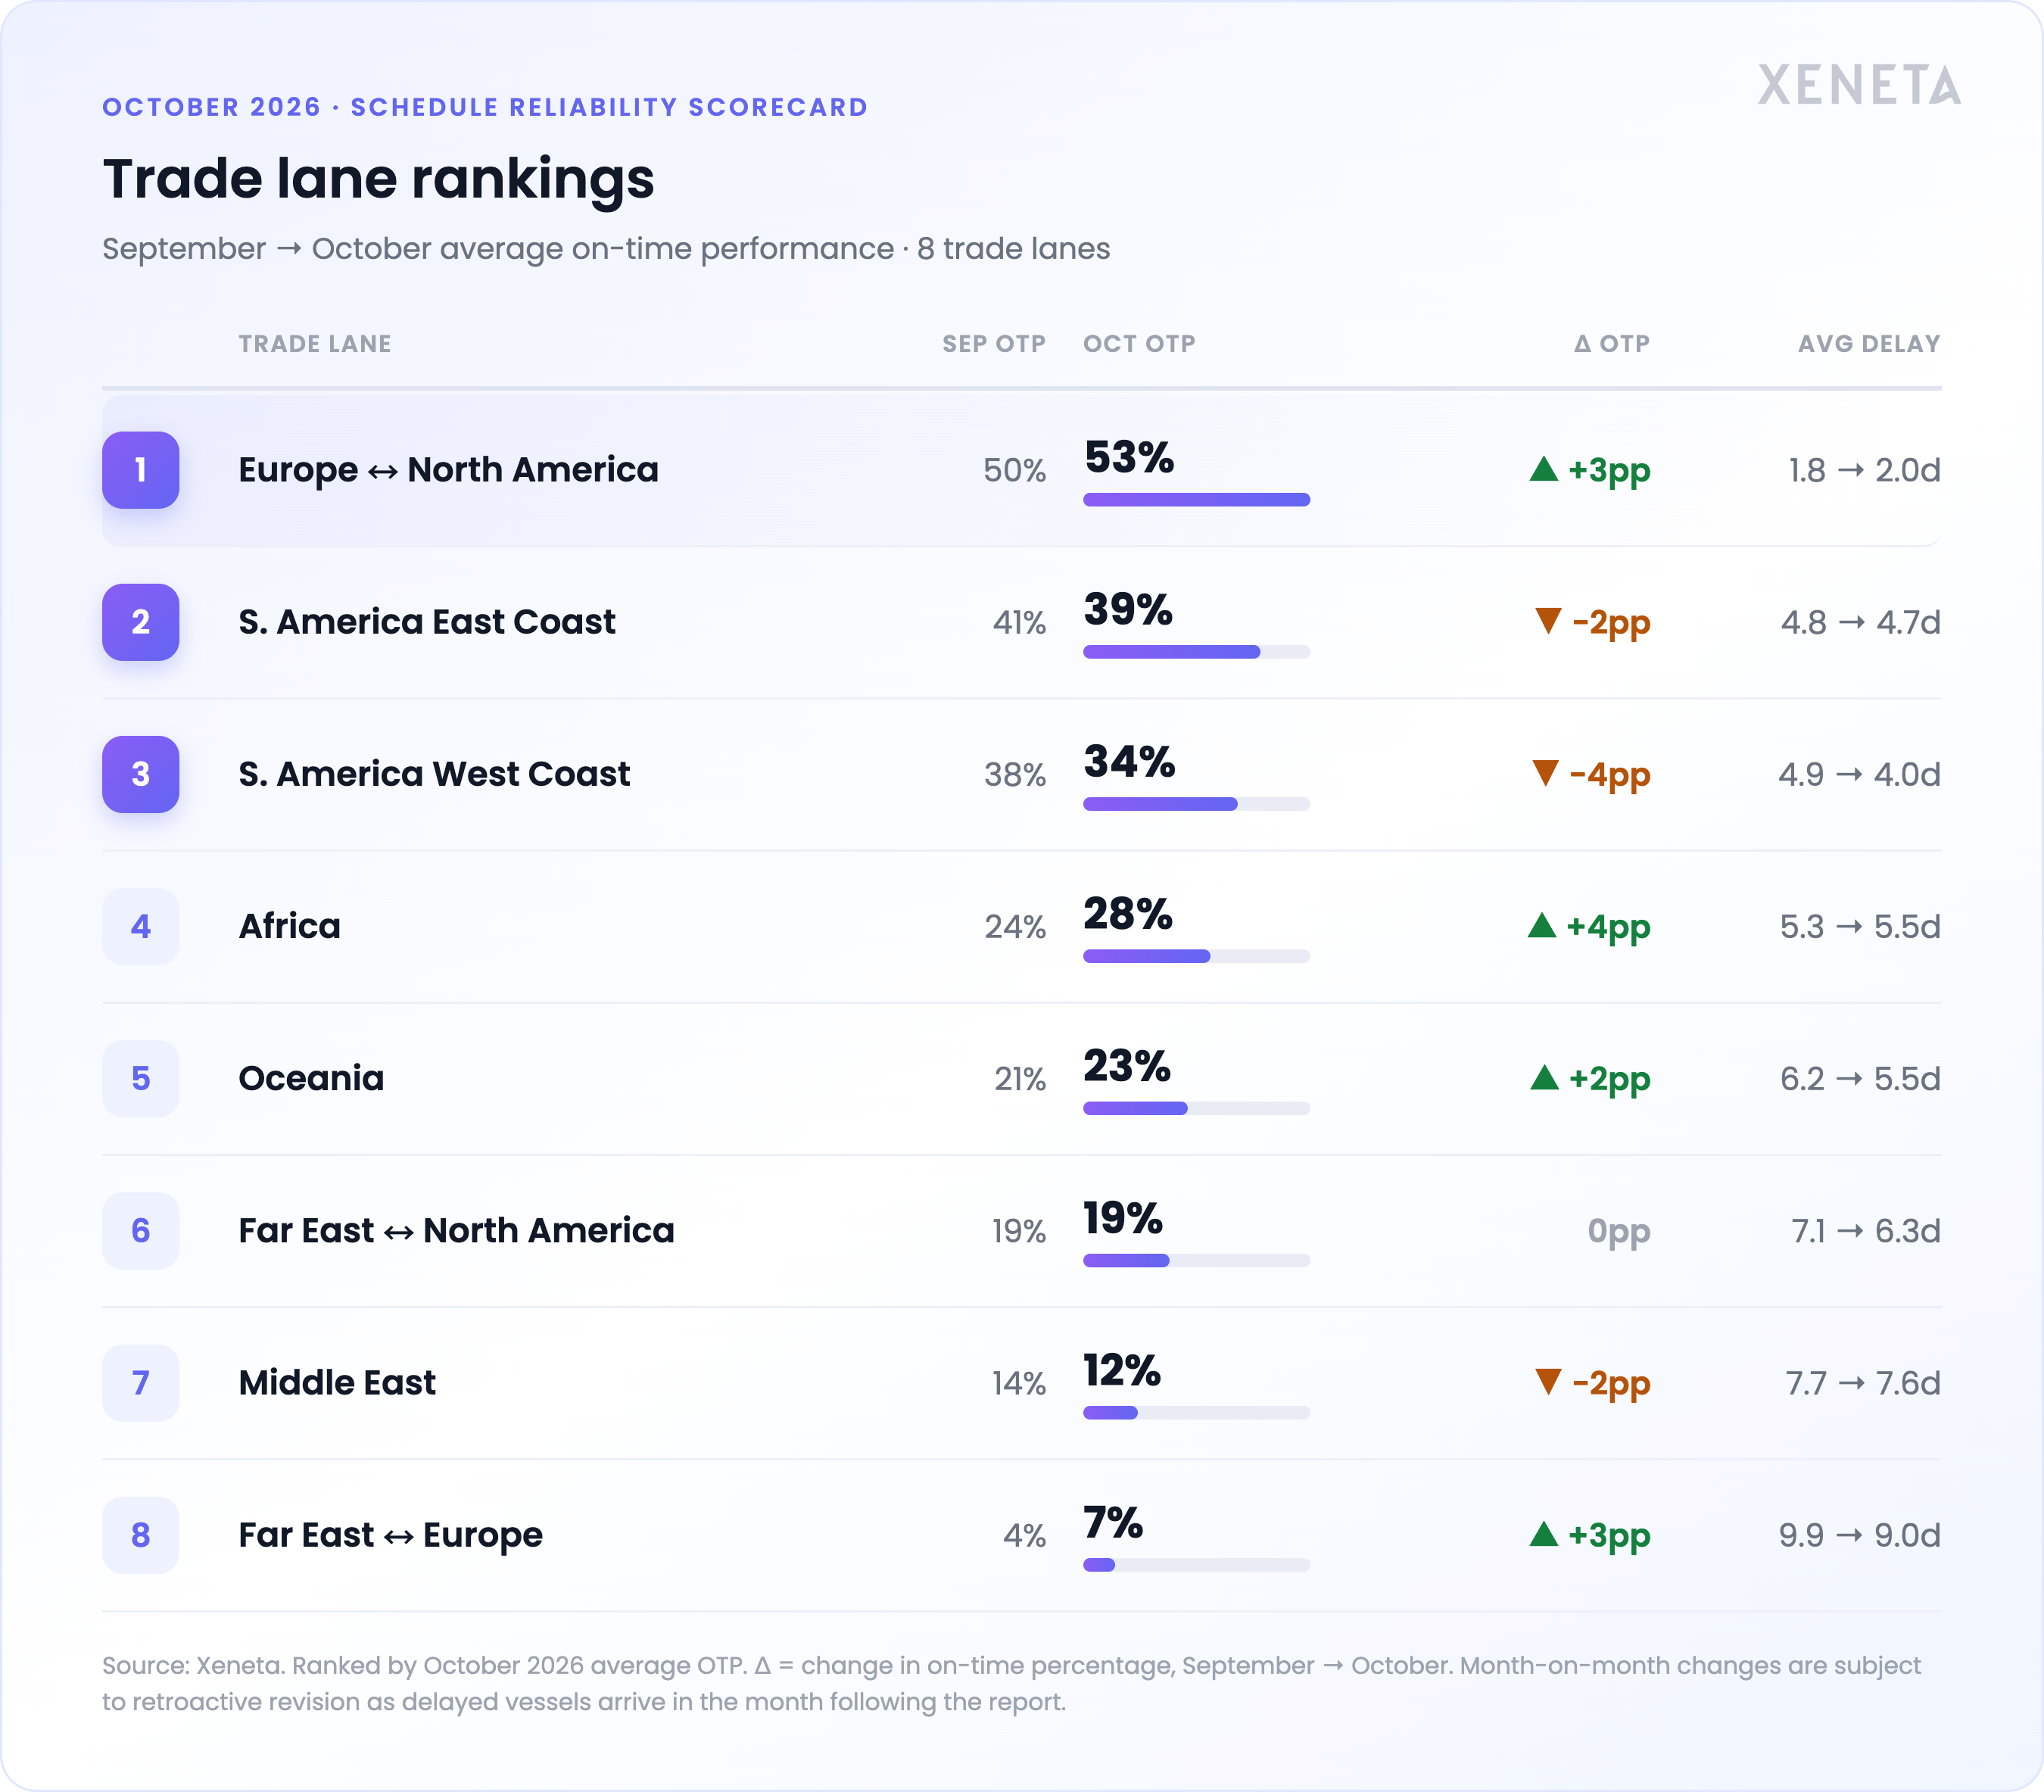
Middle East schedule deterioration reveals progressive wear on alternative Persian Gulf gateways. Down by 2pp to 12%, the trade is now at its lowest on-time since the beginning of this data series in January 2020. As what was initially a temporary network design is retrofitted to permanence, there is still little slack to spare despite improvements to inland corridor transportation and the restriction of merchant haulage volumes in hubs like Jeddah.
Europe to North America leads again this month at 53% on-time and just 2.0 days of average delay, a stark contrast to the other E/W arteries and the lowest delays of any global trade.
Carriers & Alliances: Gemini falls behind non-alliance services on two major trades
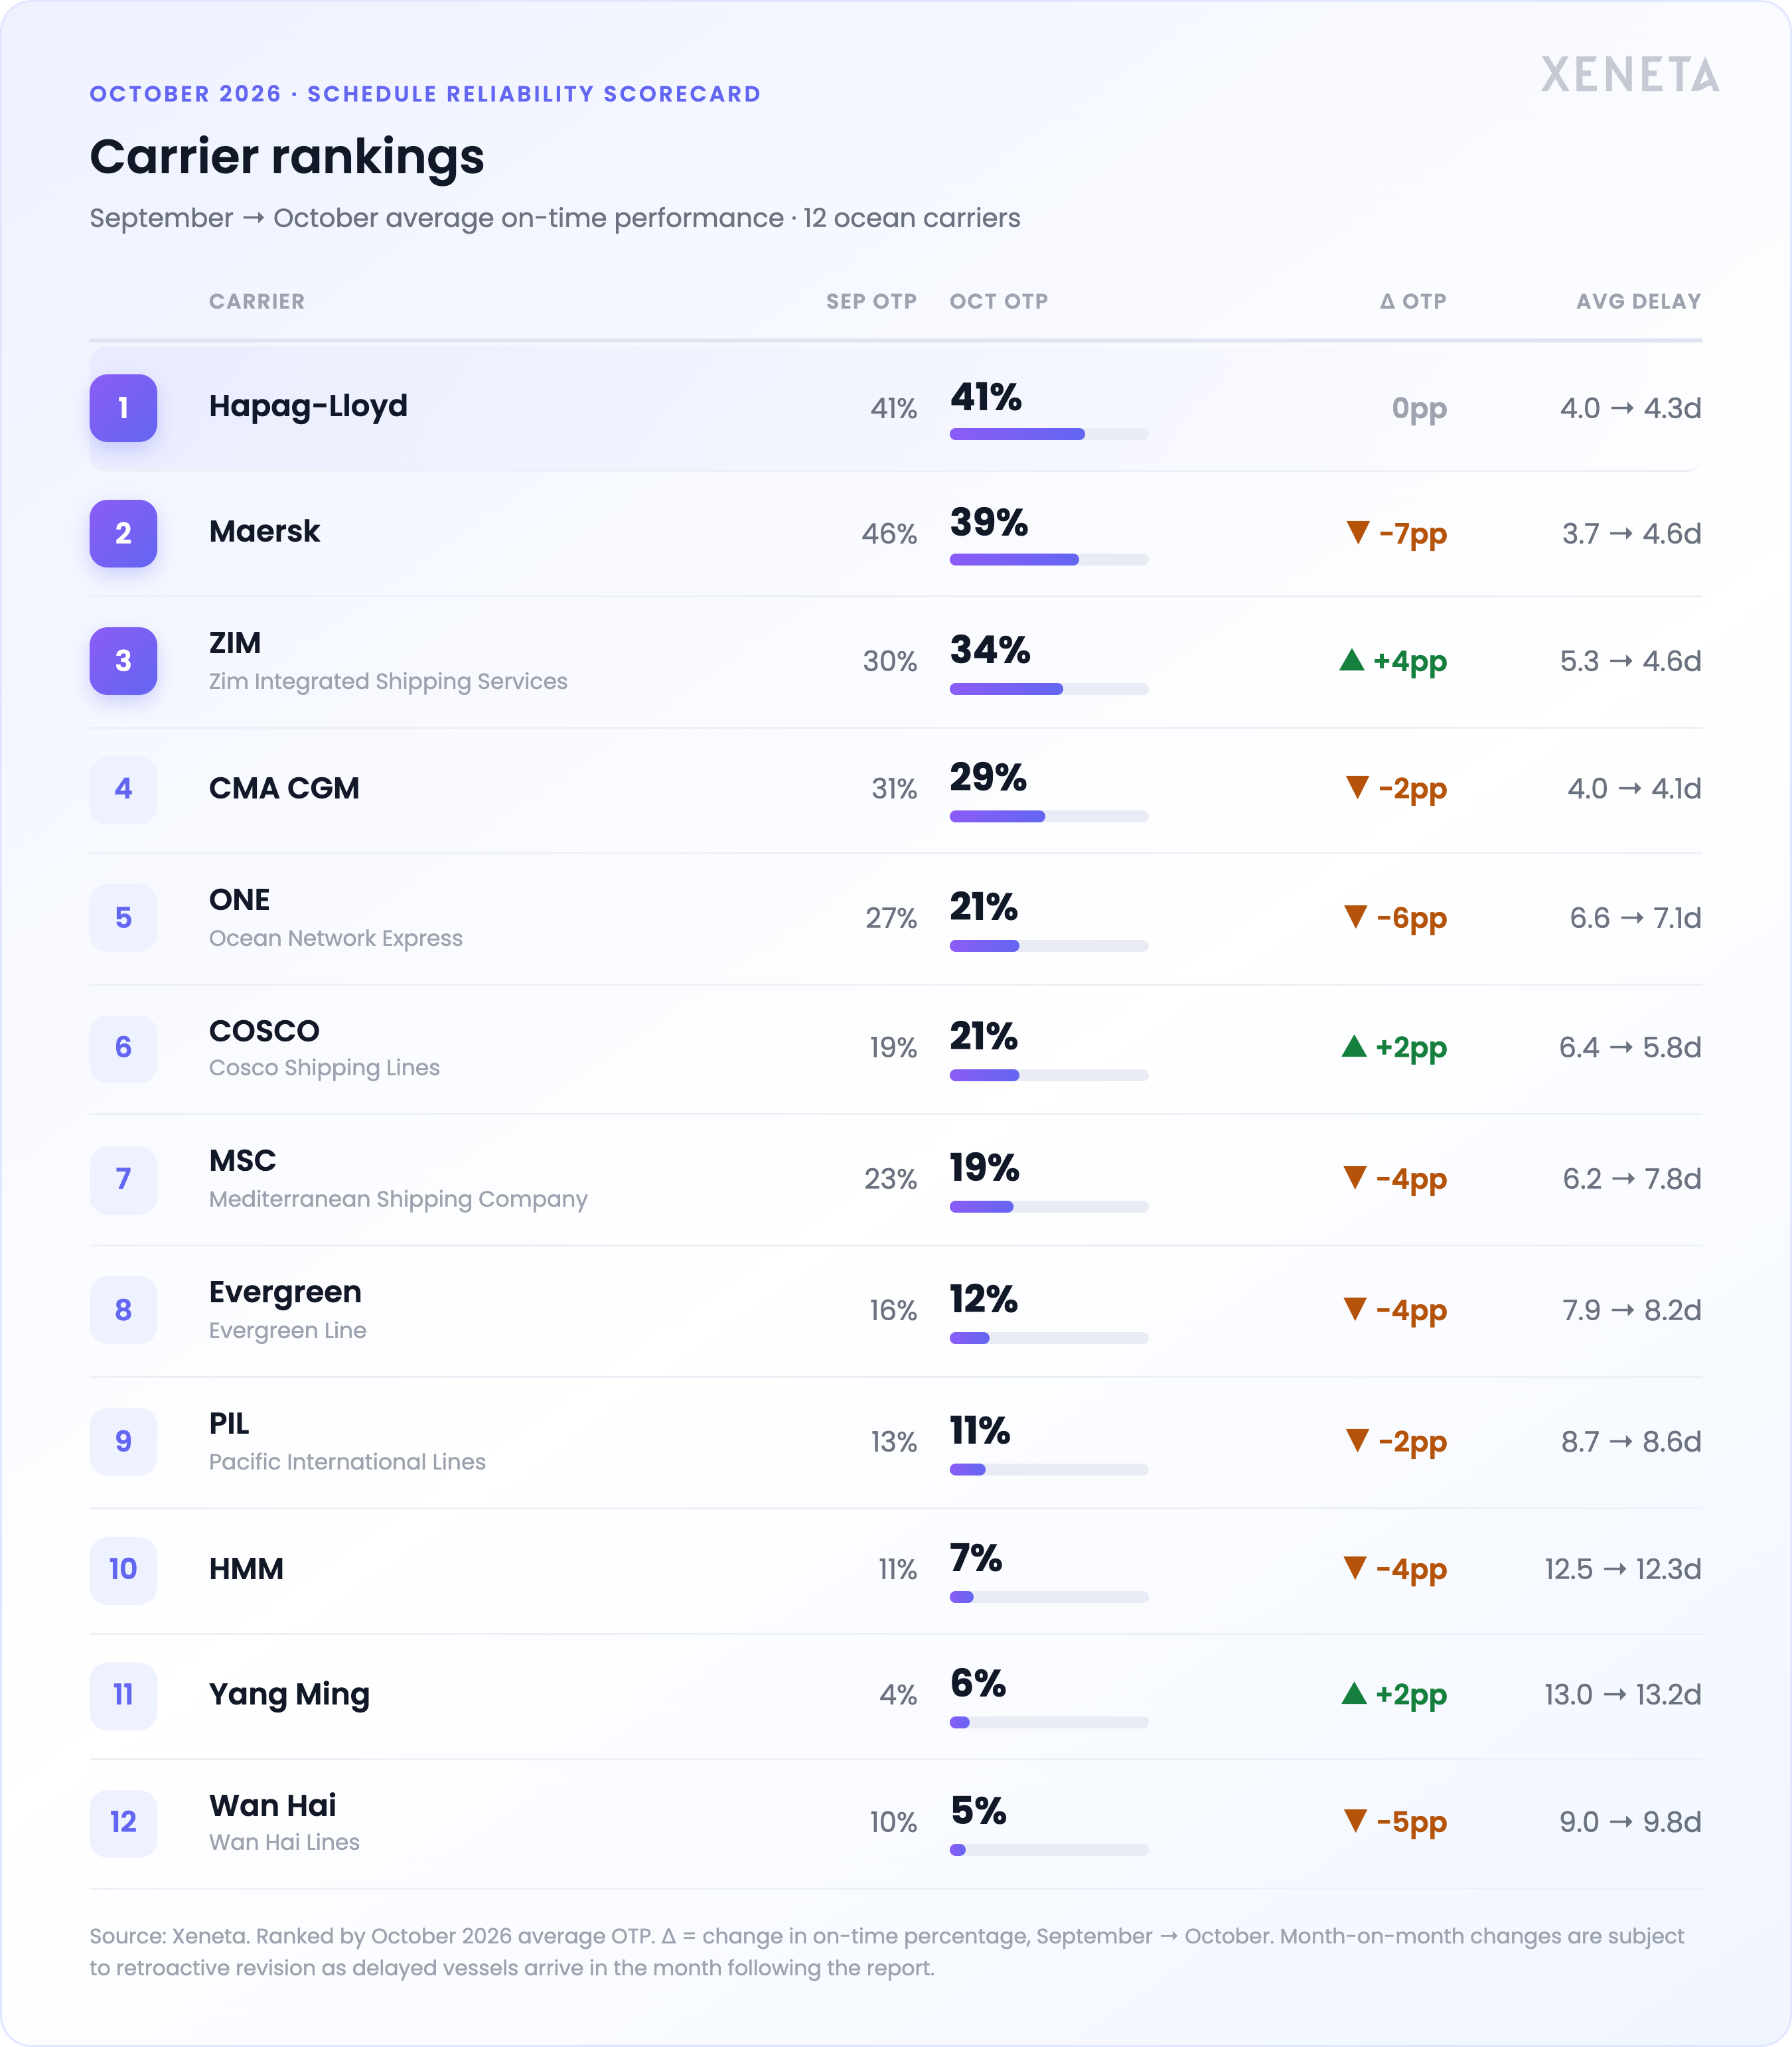
The spread between carriers has narrowed yet again, from 42pp down to 36pp, slicing the reputation of its top performers. Maersk lost 7pp to 39% in October, the largest fall of any carrier, while Hapag-Lloyd held at 41% on-time. Wan Hai and Yang Ming, at 5% and 6% respectively, have been in the bottom three for five months running.
Gemini’s on-time lead over non-alliance services has declined sharply since September. Split by trade, it has disappeared entirely on both Far East to Europe (7% vs 23%) and Far East to North America (18% vs 39%), where their services now run 16pp and 21pp below non-alliance strings. On Far East to Europe, Gemini’s average delay is 9.4 days; longer than Ocean Alliance (6.8 days) and MSC (7.8 days) but still short of non-alliance services (9.9 days) and Premier Alliance (11.0 days).
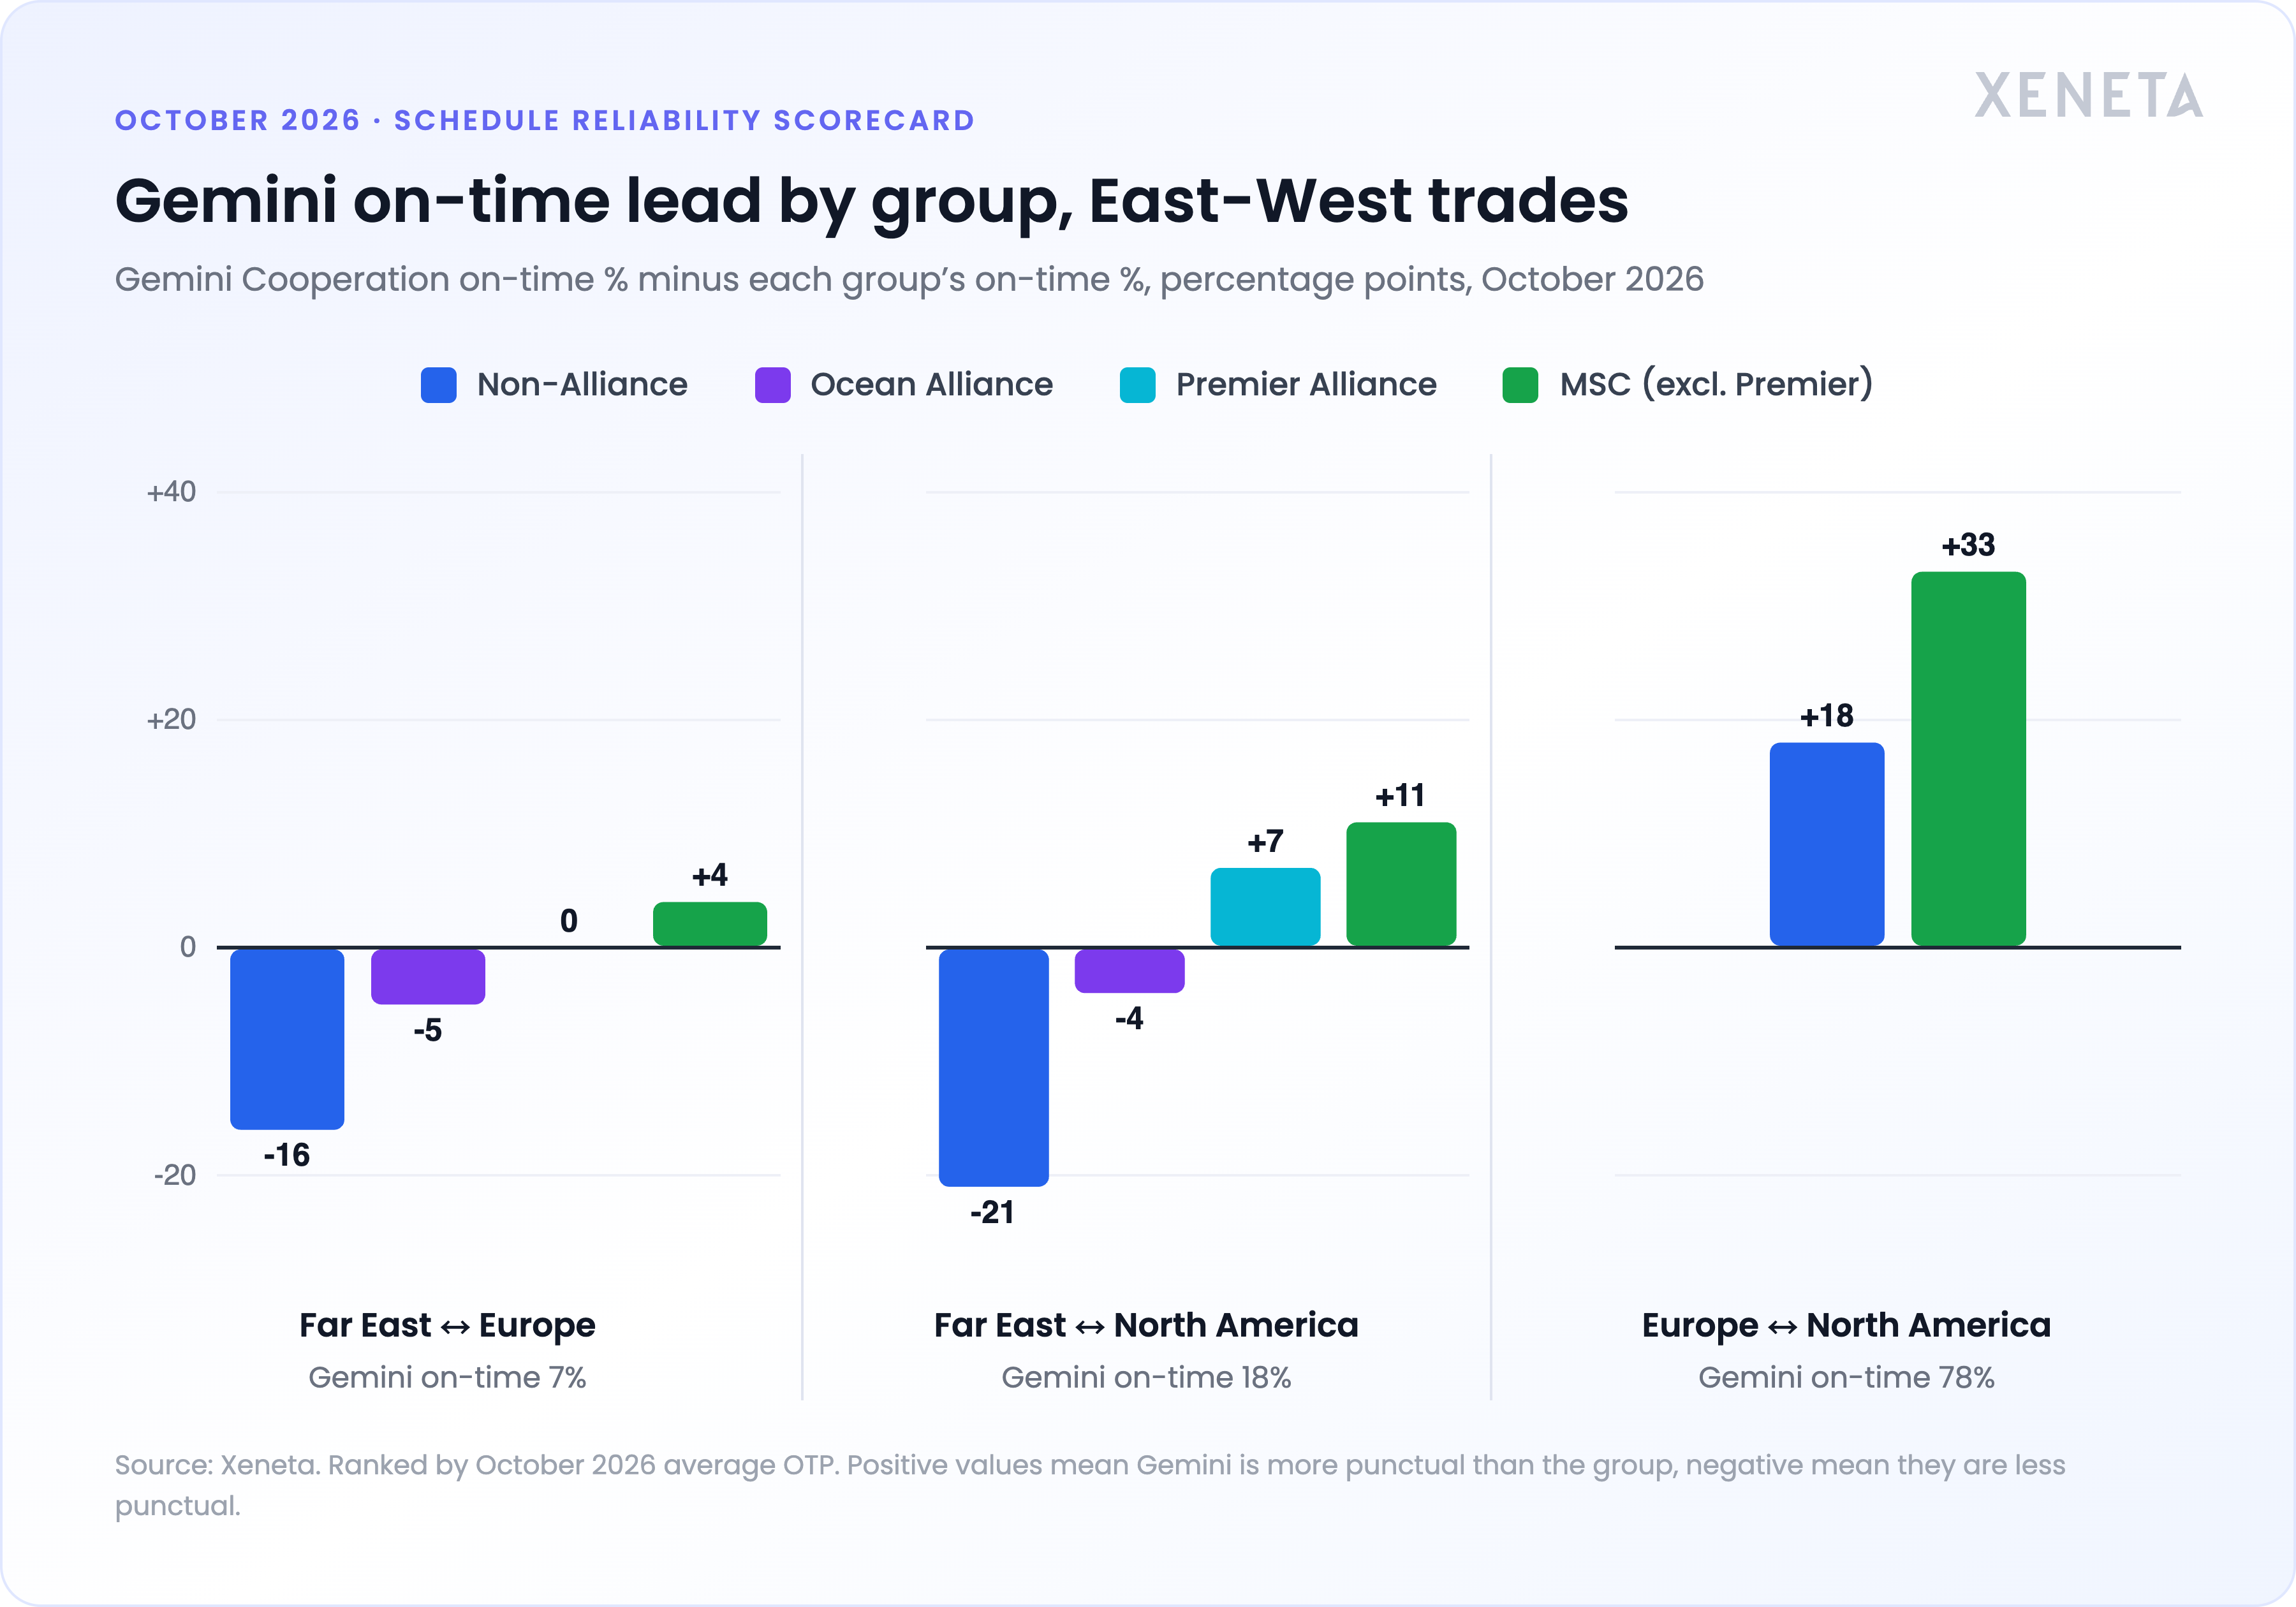
Carriers charging a premium for reliability will have to defend their positions trade-by-trade this tender season. Shippers should ask for lane-level reliability as a progressive time series, not alliance averages or 6-month trade values, before agreeing to 2027 contract rates.
Port Congestion: Africa leads and Shanghai’s queue unravels without yielding trade recovery
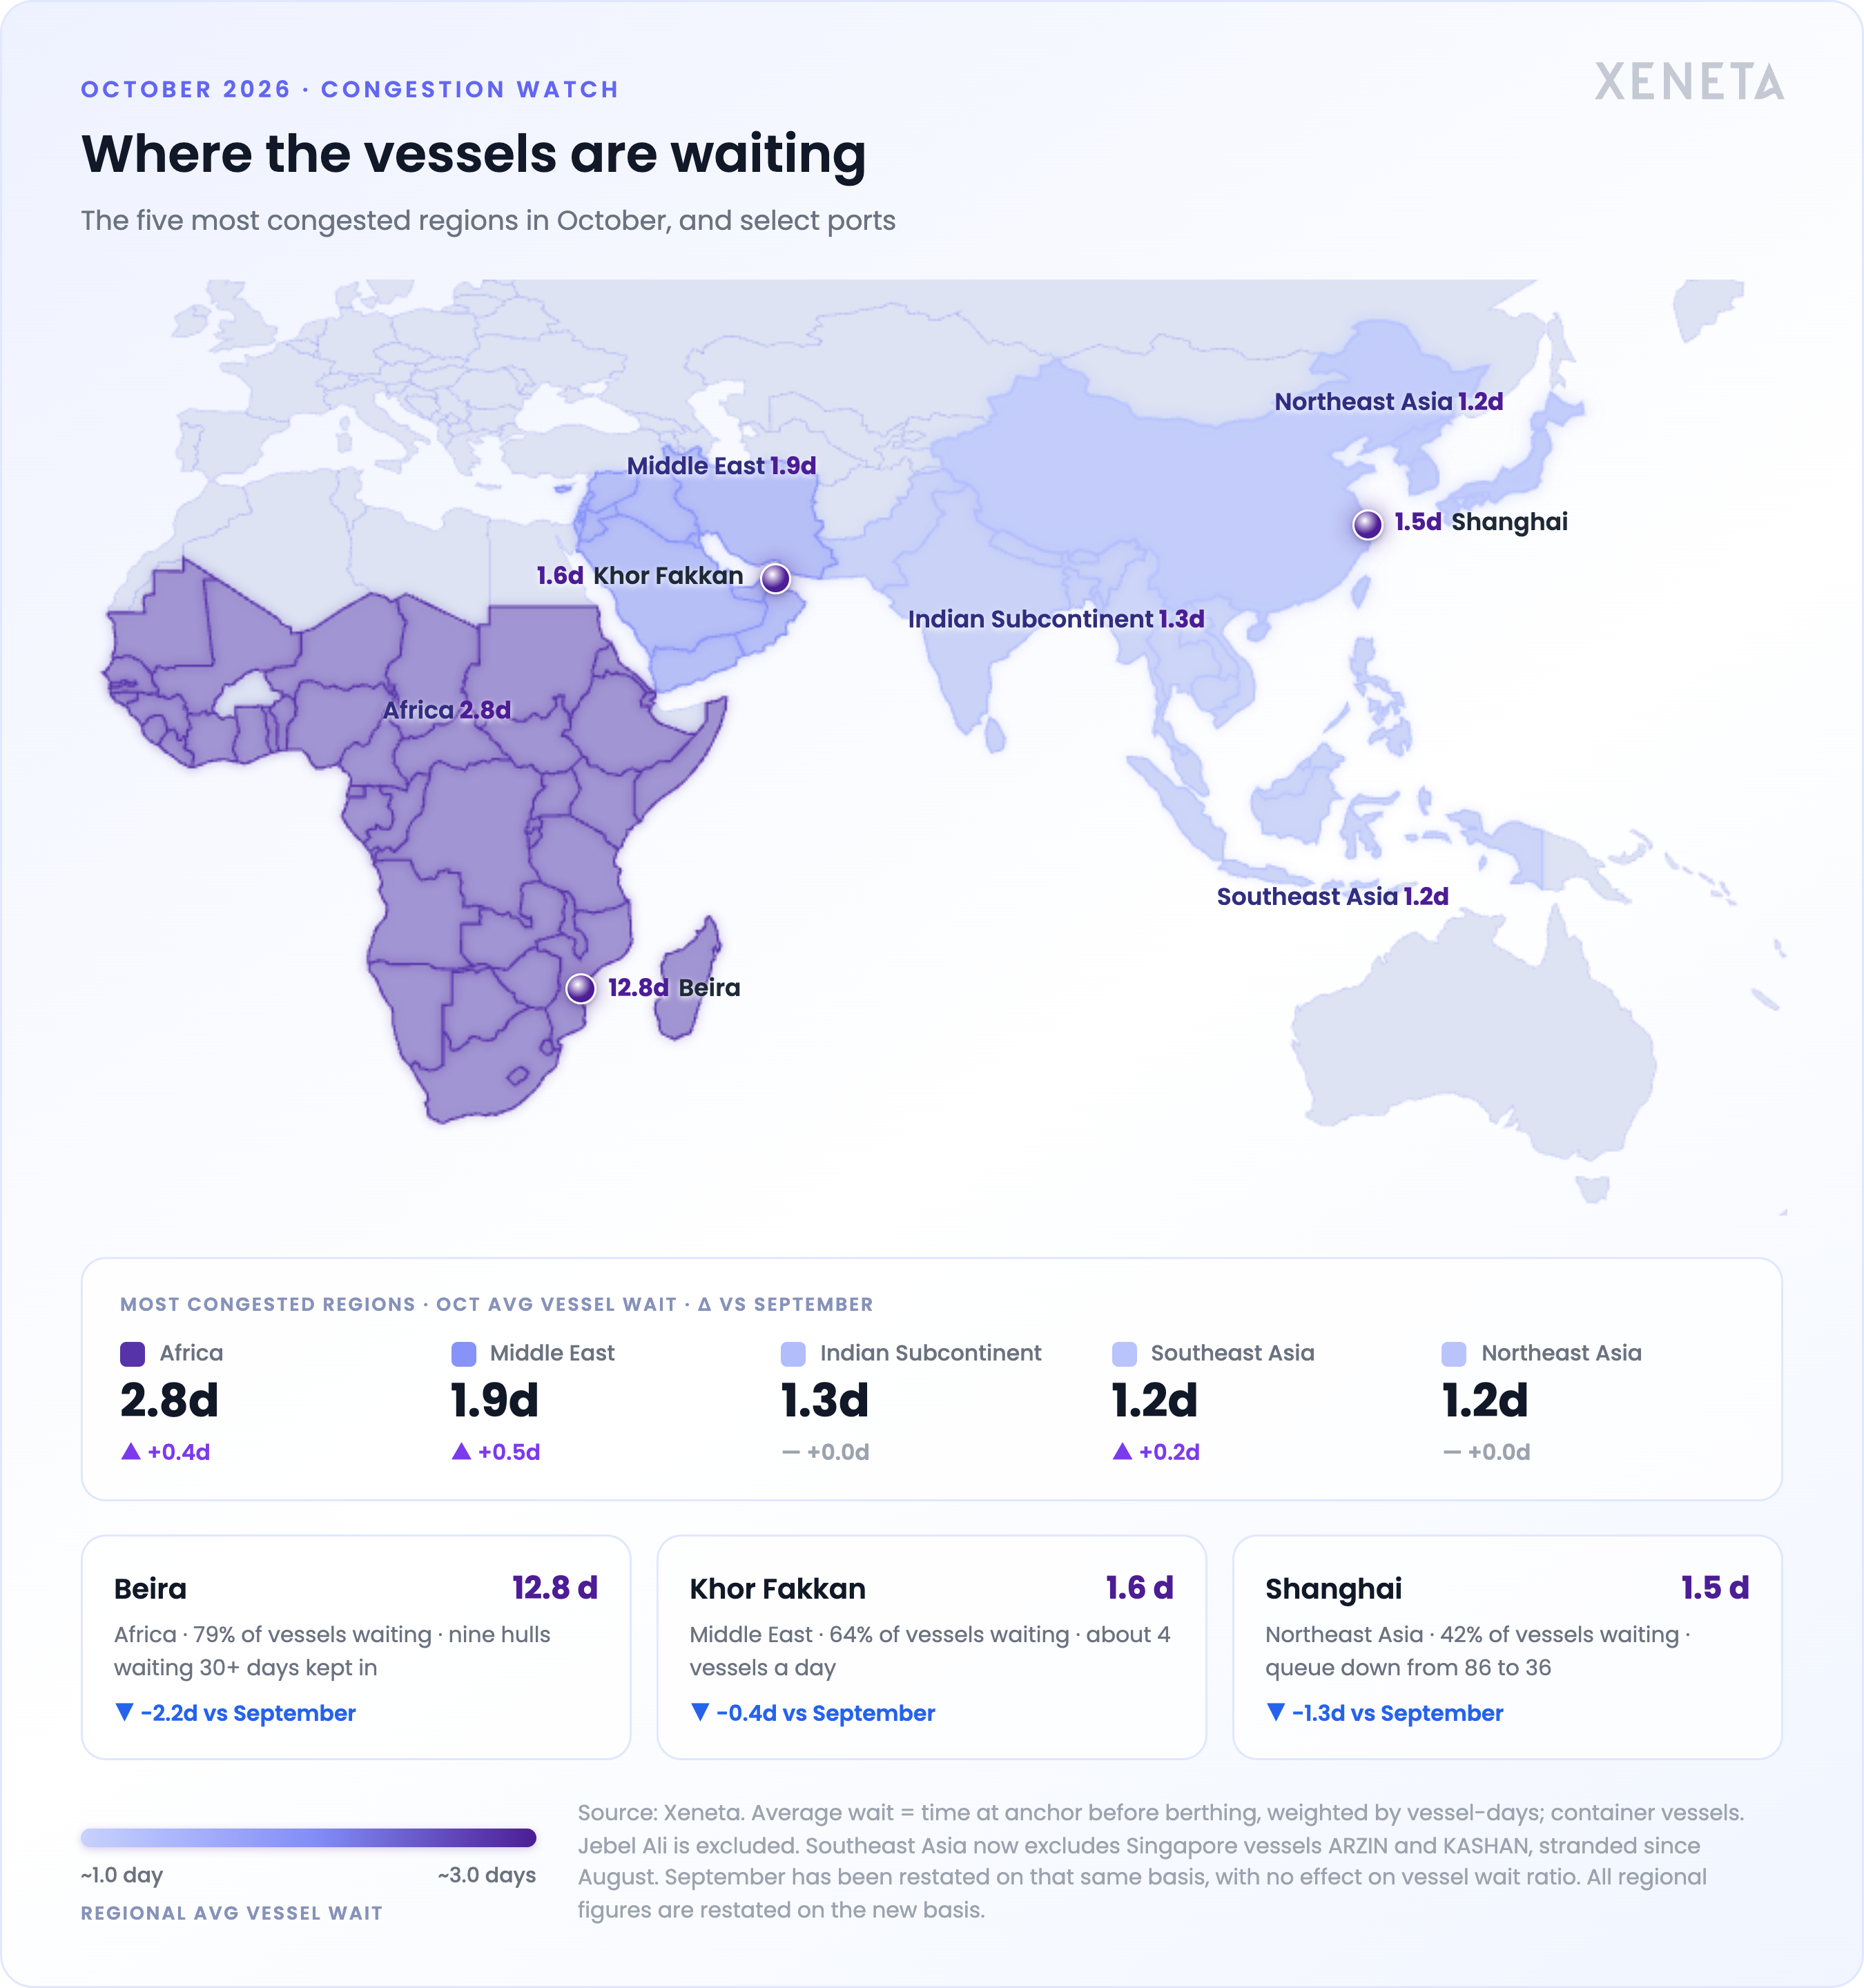
Africa still leads the regional congestion rankings, with 33% of vessels waiting on any given day and 2.8 days of average wait. The port of Beira alone averages 12.8 days of wait and a 79% waiting ratio – those numbers are not skewed by any single hull.
The Middle East follows at 1.9 days and a 27% queue, with 81% of vessels waiting at Fujairah and 64% at Khor Fakkan in the Gulf of Oman, against 17% at Jeddah in the Red Sea.
Northeast Asia saw the wait share ease from 30% to 26%, but the underlying problem is stubborn: chronically embedded schedule delays rarely unravel at the same pace as vessel queues. Shanghai’s average daily queue fell from 86 to 36 vessels in October, but carriers still omitted 35% of scheduled loading calls at the hub on Far East to North America services, compared to 0% in October 2025.
Spotlight Blanks picked up in October on all three East-West trades but only transatlantic increased against 2025
As expected with the windfall of Chinese Golden Week and the Autumn Festival, carriers blanked 18% of planned capacity on Far East to Europe, up from 6% in September, but still below 21% of planned TEU in October 2025. Part of that gap is explained by schedules; planned capacity also grew 15% year-on-year so blanked TEU in the month of October is roughly level at 407,000 TEU in 2025 vs 396,000 TEU in 2026.
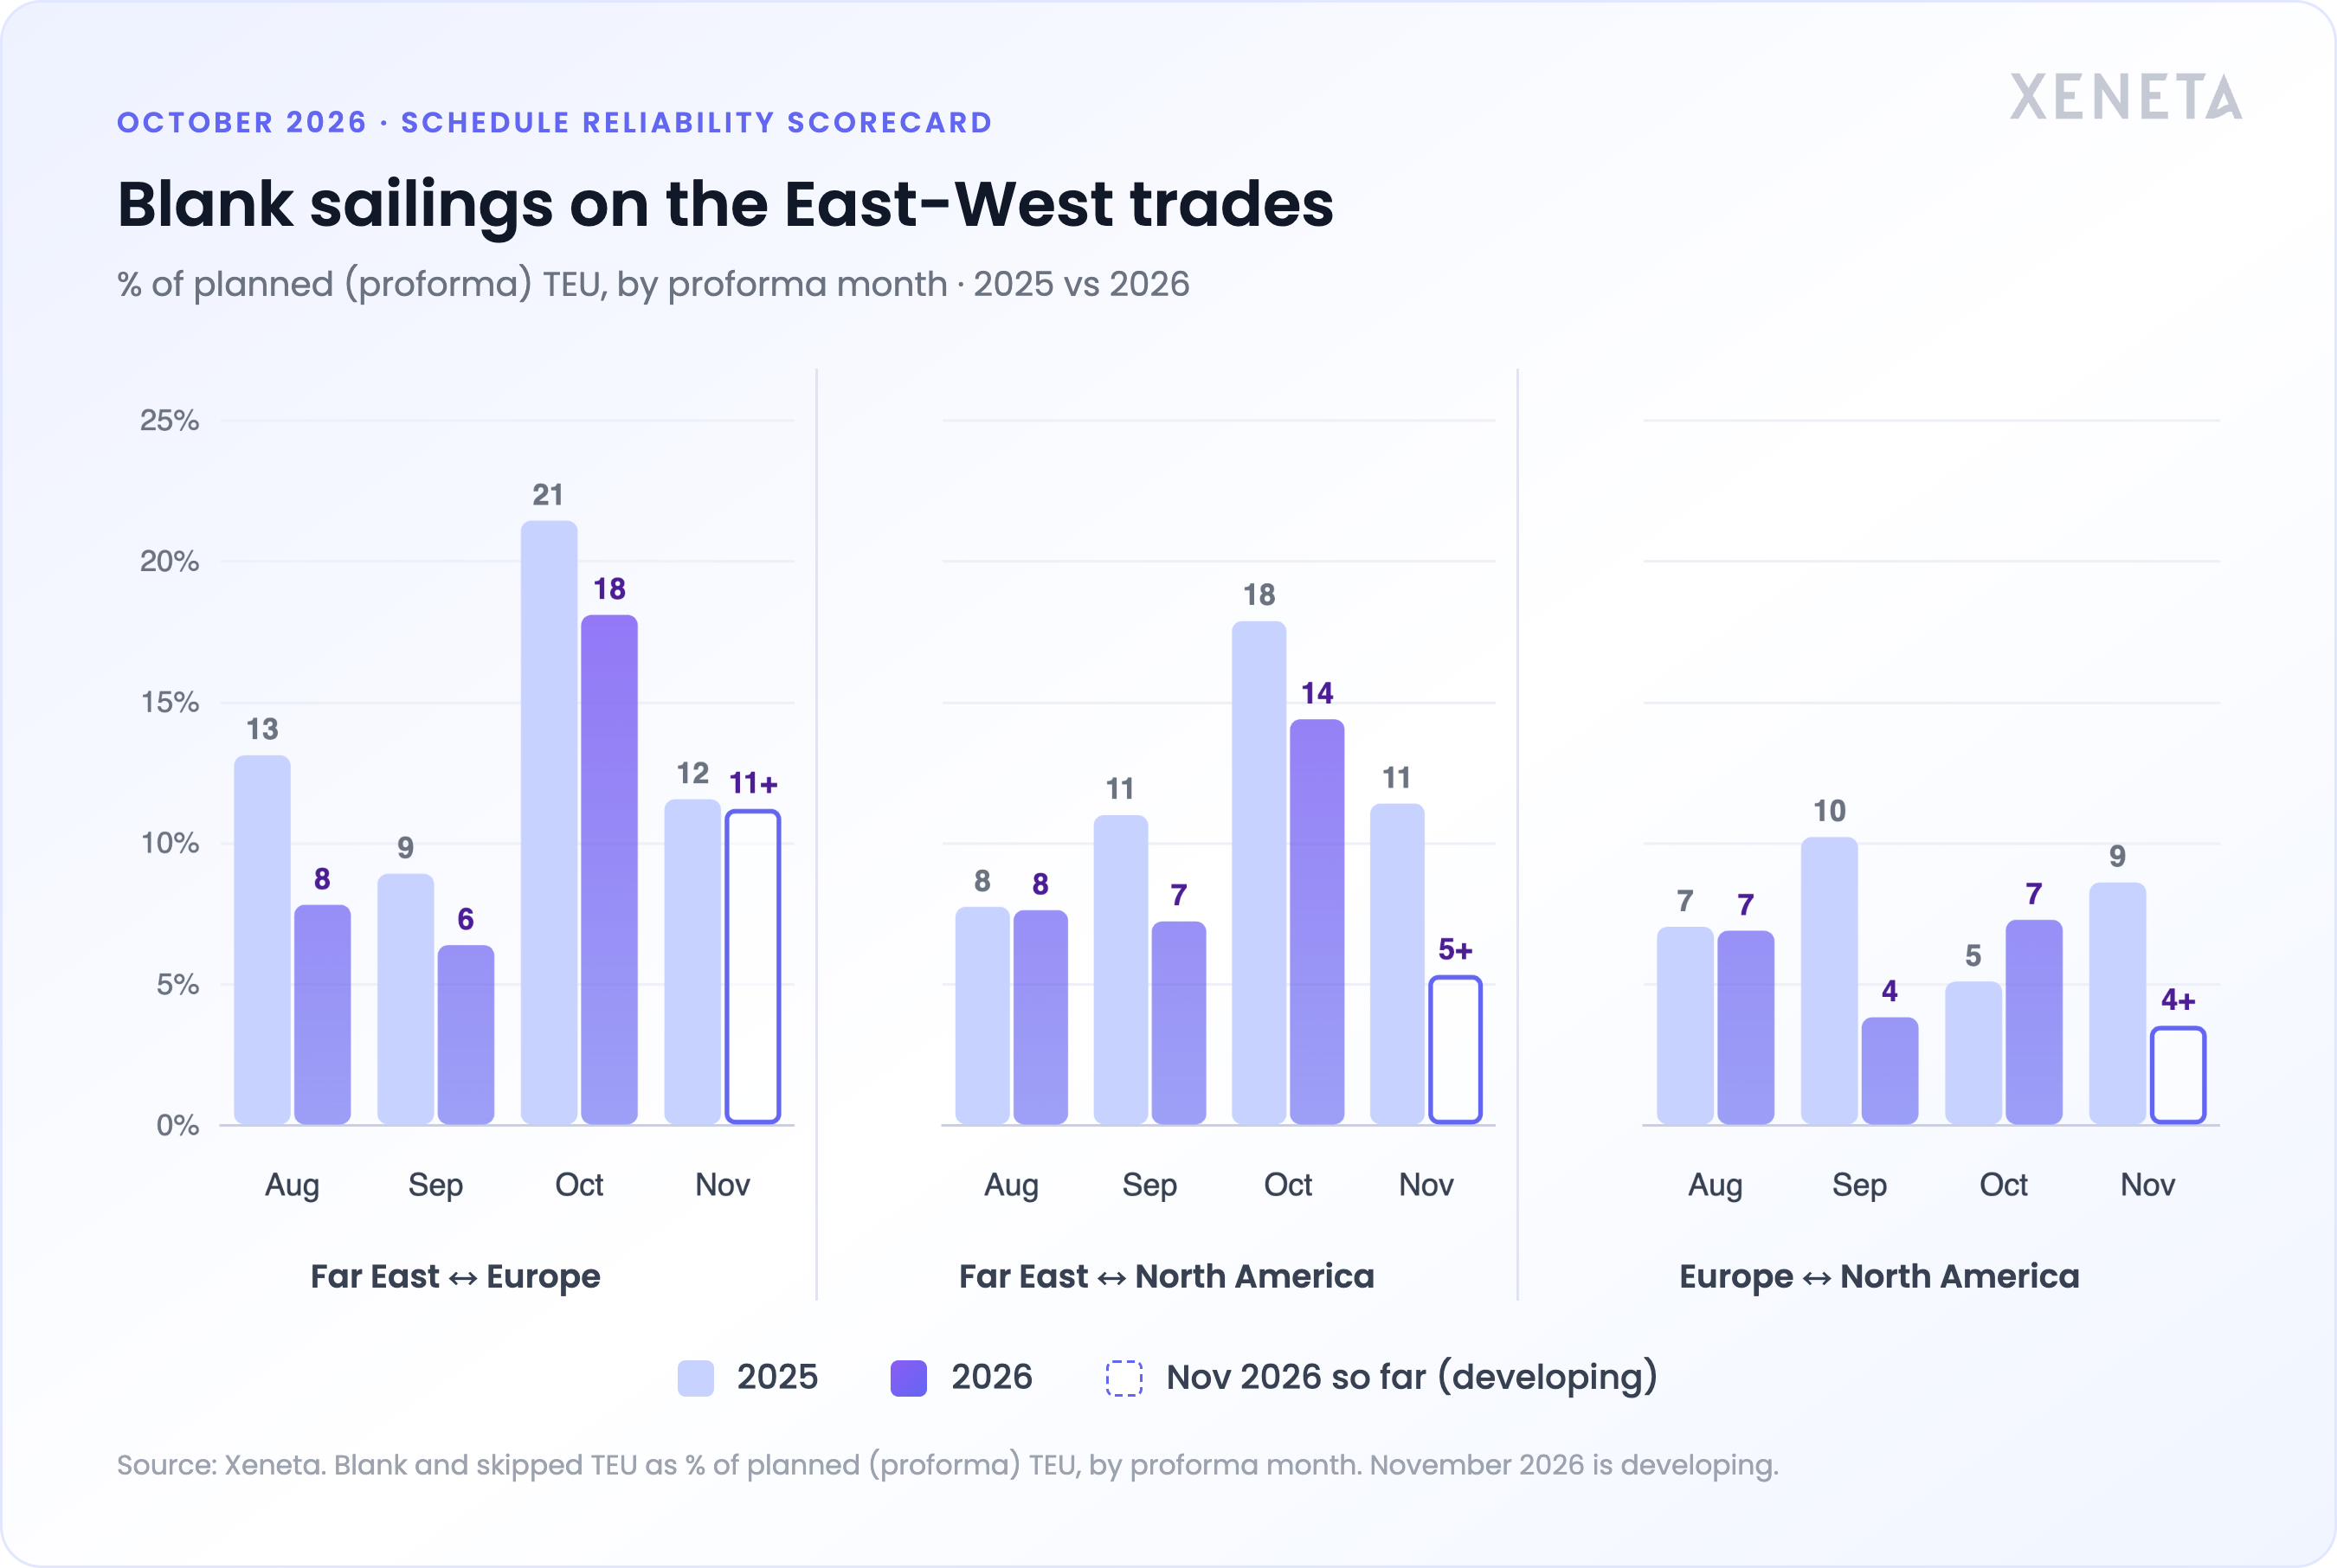
On Far East to North America, carriers removed 14% of planned capacity, up from 7% in September, and a 4pp drop against October 2025. Planned TEU has grown by just 4% against last year, so the drop was genuinely less blanking on this trade, from 467,000 TEU in October 2025 to 393,000 TEU in 2026.
These blanks supported the reliability lift by the same small margin in both years. In October 2025, the 21% blanked on Far East to Europe propped a 3pp rise from 22% to 25% in on-time arrivals. This October, an 18% blanked rate nudged on-time another 3pp from 4% to 7%. Built on a baseline 18pp lower than 2025; the delays in the network are too deep for cancelled sailings to reset reliability in a meaningful measure.
What to watch
-
Tenders are being set against a market with little slack to absorb disruptions. With a narrower 36pp on-time band across carriers, the tightest since March 2026, shippers need to book service-level reliability and work on-time, average delay, and cancellation rates into their RFQs.
-
Don’t take performance for granted, even on steadier lanes. Gemini’s Atlantic lane has weakened from 76-92% on-time every week from late July to 52% in the final week of October. Delay provided an earlier signal: rising from 0.3 days in late September to 1.0 day at the end of October, and again to 1.25 days in early November.
-
Treat the minimal improvement on Far East to Europe as provisional. An easing in vessel congestion does not mean that a port is freed from berth schedule delays or high yard utilization. The compound effects of back-to-back terminal closures unwind slowly long after vessels start to move.
From a macro view of fleet vs demand dynamics down to a detailed analysis of Red Sea and Persian Gulf network development, our Ocean Outlook 2027 has you covered on where the market goes from here.