See how Nestlé cut manual work, compressed tender cycles, and elevated procurement decisions with real‑time data
A unified view of the air freight market, powered by 13 datasets, expert insights, and tools built for faster, data-driven decisions.
Trusted by the world's biggest buyers & sellers of freight
Xeneta Air provides a complete, unparalleled view of the air freight market.
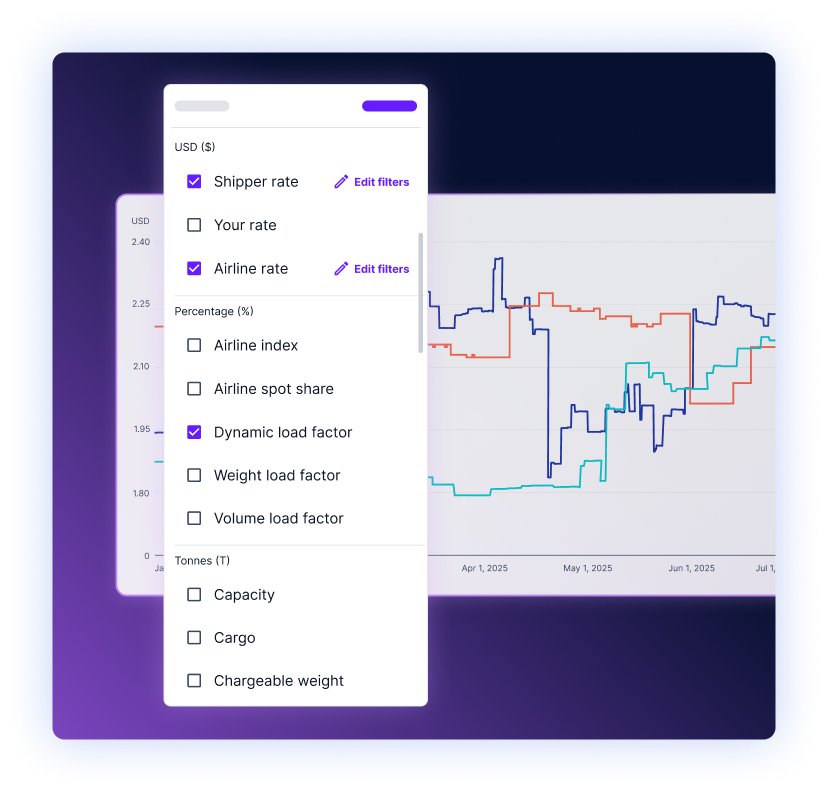
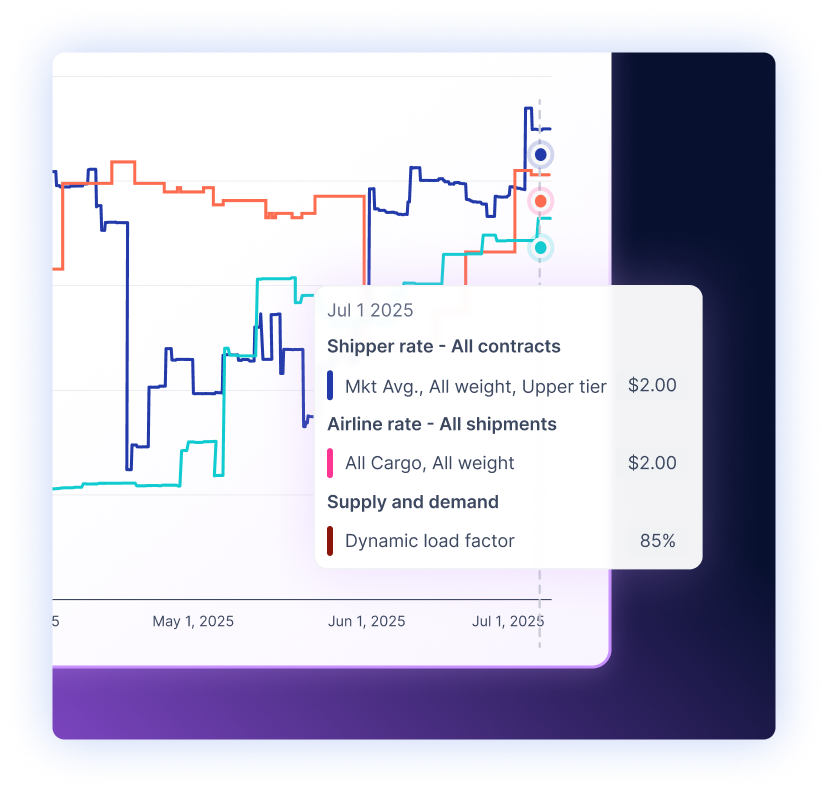
Price is only part of the equation. Understand capacity constraints, demand pressure, and carrier load factors before you commit. Choose suppliers that deliver the service you need, at a cost you can justify.
Compare rates alongside service indicators like capacity and load factor
Identify lanes where carriers are overbooked or underselling
Balance cost against risk to support time-critical shipments
Justify selections internally using data-driven rationale
Prioritize supplier reliability and performance, not just cost
Spend less time validating quotes and more time making decisions. Xeneta Air removes the manual lift by automatically benchmarking lanes and surfacing the insights you need to evaluate supplier bids and set negotiation targets.
Upload and benchmark thousands of lanes in minutes
Filter by corridor, contract type, or rate window
Assess bid competitiveness with real-time market data
Set realistic targets for RFPs and avoid inflated awards
Align internal teams quickly with clean, data-backed insights
Walk into every conversation with facts, not assumptions. Use Xeneta’s integrated market view to challenge supplier quotes, surface leverage points, and close stronger, faster deals.
Validate offers against live market benchmarks
Push back on inflated quotes using clear historical and forward-looking trends
Use sell-side data to understand airline pricing behavior
Identify negotiation opportunities across key lanes
Strengthen your position in contract and spot discussions
Everything you need to analyze, act, and stay ahead in air freight.
Supporting every link in the air freight value chain.
As seen in
How does Xeneta benchmark air freight rates?
Xeneta benchmarks real contracted and spot rates across more than 60,000 airport-to-airport pairs, using data contributed directly by global shippers and forwarders. With 7.6 million+ freight rates in the platform, it provides one of the most comprehensive views of the air freight market available, covering everything from rate benchmarks and capacity data to load factors and demand pressure.
For any lane, you can view where your contracted rates sit against the market, identify corridors where you're overpaying, and understand the capacity and service context behind the numbers, not just the price. This matters in air freight because cost and reliability are closely linked: a cheap rate on an overbooked lane carries real operational risk.
All data is contributed anonymously by shippers and forwarders and fully aggregated before being published, so no company-specific rates or supplier names are ever disclosed. The benchmarks reflect what the market is actually paying, not published tariffs or indicative spot prices, giving you a factual basis for procurement decisions, negotiations, and tender preparation. To learn more about our data and how it's sourced, visit our Our Data page.
How is Xeneta air freight data different from published air freight indices?
Can air and ocean freight rates be benchmarked on the same platform?
Yes, and it's a meaningful differentiator. Xeneta is the only platform that provides comprehensive, neutral market intelligence across both ocean and air freight in one place.
In practice, shippers rarely manage air and ocean in isolation. Air freight is typically used for time-sensitive, high-value, or disruption-driven shipments, while ocean handles higher volumes on longer lead times. When market conditions shift, such as a port congestion event or black swan event, procurement teams need to quickly understand the cost and availability trade-offs across both modes before making a decision.
Having ocean and air benchmarks on the same platform means you can monitor both markets continuously, compare costs when mode-switching decisions arise, and avoid the blind spots that come from using disconnected tools. Whether you're managing a mixed freight portfolio or evaluating when air makes commercial sense versus ocean, Xeneta gives you the full picture in one view.
How do I build a business case to justify air freight rate improvements using Xeneta?
Air freight typically represents a disproportionate share of logistics cost for companies shipping time-sensitive or high-value products. Xeneta enables you to quantify exactly how far above market your current air contracts are, expressed in dollar terms per lane or in aggregate. This provides the foundation for a concrete business case: if your air freight spend is $10M annually and Xeneta identifies a 12% gap to market on your top lanes, the potential saving is $1.2M.
Finance teams respond to data-backed insights, and Xeneta provides the independent, third-party evidence needed to make that case credibly. With lane-level benchmarks built from real contracted rates across shippers, forwarders, and airlines, you can see exactly where you stand relative to peers with comparable volumes and similar industry profiles, not just where the spot market is trading.
This is where Xeneta's incrementality over less accurate data sources becomes tangible. Published indices reflect a partial view of the market: spot-only, marketplace-skewed, or based on a limited set of corridors. Building a business case on those numbers risks understating the true gap, or worse, presenting savings that don't materialize because the benchmark wasn't representative to begin with. Xeneta's multi-sided contracted rate data gives finance and leadership teams a defensible, accurate baseline, one that holds up to scrutiny when the numbers are put in front of a CFO.
What support does Xeneta provide to help customers get the most out of the platform?
Xeneta's customer success and value teams work directly with customers throughout the contract, not just at onboarding. From initial setup through to ongoing analysis, reporting, and regular business reviews, the goal is to make sure teams are applying Xeneta's data to the decisions that matter most to their procurement, not just learning where to find things in the platform.
The depth of that support scales with the bundle. All customers receive onboarding guidance, with higher tiers including dedicated customer success manager sessions, quarterly business reviews, and for the Achieve tier, a 30-day onboarding workshop and a named CSM throughout the contract period. That dedicated relationship means your CSM understands your lane network, your procurement calendar, and your priorities, and can help you act on market movements rather than just observe them.
Beyond the success team, customers receive access to exclusive market insights and reports that go beyond what's publicly available, giving procurement teams a more detailed view of conditions affecting their specific categories and corridors. For teams that want analyst-led support taken further, Xeneta Advisory provides tailored tender and leadership reports built around your business specifically. Contact the team to find out what support level is right for your organization.