
Secure the right service at the right price
Negotiate and manage suppliers with real market visibility on rates, reliability and transit times across every trade.
Trusted by the world's largest
shippers, forwarders, carriers and airlines.












Freight pricing is often a gamble
Carriers quote best-case transit times and reliability. Without independent data, you can't challenge them.
Quotes without context
Relying on carrier quotes alone hands control of price and service to suppliers.
Squeezed margins
Liner rates that drift from the market quietly squeeze procurement margins.
Weak reporting
Poor visibility undermines the credibility of reports and plans you share.
Judge every carrier on cost and reliability
Live rate benchmarks and independent performance data guide every pricing and procurement decision.
Benchmark rates visual
This page could not be loaded. Please try again later.
See if each carrier is priced fairly
Benchmark contracted rates by carrier and lane against the live market, so you avoid overpaying and protect margin.
Contracted rates vs market, by carrier
Long- and short-term benchmarks
Lanes drifting above market flagged
Score reliability visual
This page could not be loaded. Please try again later.
Check carrier claims against real arrivals
Schedule reliability and actual transit times by carrier, based on real vessel arrivals, so best-case quotes can be challenged.
Reliability by carrier and trade lane
Actual vs announced transit times
Evidence for every volume award
Score carriers visual
This page could not be loaded. Please try again later.
Rank carriers on what matters to you
A weighted scorecard combines rate, reliability, transit time, capacity and emissions into one score per carrier on each corridor.
Weight each metric to your priorities
One score per carrier and corridor
Evidence for quarterly carrier reviews
See carriers compared on cost and service
A Xeneta specialist benchmarks carrier rates, checks schedule reliability and compares transit times on the same lane.
Every scorecard is built on independent data
Rates come from what shippers and forwarders actually paid. Reliability comes from real vessel arrivals, not carrier claims.
- Contracted rate data points
- 900M+
- Ocean port pairs
- 170k+
- Airport pairs
- 20k+
See how shippers hold carriers accountable

Rate vs service, rebalanced to 70/30
Hitachi Energy weighs rate against service with Xeneta data across 15,000 TEU a year.
Read the case study
Every tender bid benchmarked
Shipping 100,000 TEU a year, Continental validates bids and tracks supply chain performance.
Read the case studyHear from our customers
How shippers regain leverage in carrier-led markets
Our analysts answer the 48 questions shippers raised at our recent roundtables, so you can go into your next tender with a plan.
Get the report
Go deeper on carrier performance

Rebuilding trust in carrier performance data
Why carrier performance data breaks down, and how to rebuild a version you can trust.
Watch now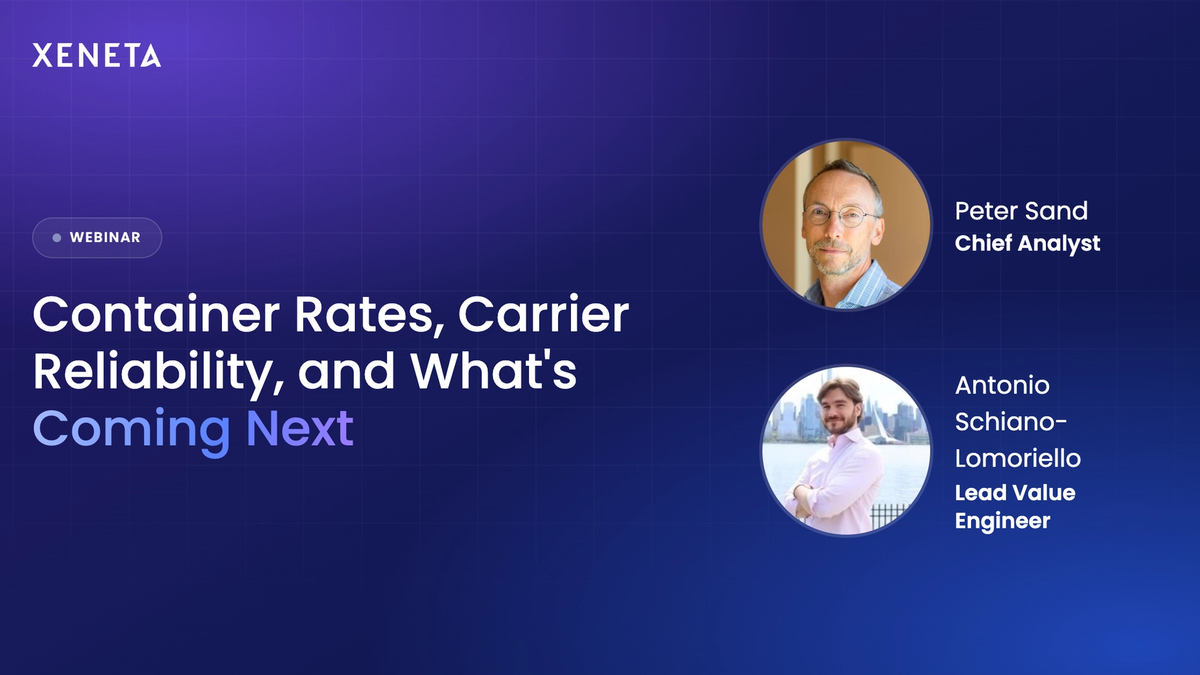
Dry cargo rates and carrier reliability
Benchmarking dry cargo lanes live and comparing carriers on price and reliability.
Watch now
Stop betting on carrier promises
A Red Sea special on tracking real carrier behaviour and reliability in volatile markets.
Watch nowCarrier performance, answered
How do I evaluate carrier performance beyond price and incorporate it into sourcing decisions?
Rate competitiveness is only part of carrier evaluation. Schedule reliability, blank sailing frequency, transit time consistency, and port-pair performance are equally critical, particularly for supply chains where a missed vessel directly triggers emergency air freight or stockout costs.
Xeneta integrates rate benchmarks with carrier performance data through Xeneta Schedules, allowing procurement teams to evaluate carriers on a cost-and-reliability matrix. This dual view is essential when presenting sourcing decisions to leadership, as it provides the evidence needed to justify selecting a slightly higher-cost carrier with materially better reliability, quantifying the total cost benefit rather than appearing to sacrifice savings.
How do I validate carrier claims about transit times and reliability during a tender?
Carriers routinely quote transit times and reliability rates that reflect best-case scenarios rather than actual operational performance. Without independent data, procurement teams have limited ability to challenge these claims during a tender process. Xeneta Carrier Scorecard provides an objective benchmark: actual schedule reliability rates by carrier and trade lane, based on real vessel arrival data. If a carrier quotes 95% on-time performance but Xeneta's data shows 72% for that carrier on that corridor, you have the evidence to question the claim and factor realistic performance into your carrier selection. Customers use this data specifically to avoid awarding volume to carriers whose low bids mask poor service reliability.
How should schedule reliability and blank sailings factor into carrier selection?
Blank sailings directly disrupt supply chains by delaying cargo and forcing rebooking on already-constrained capacity. Carriers with high blank sailing rates on specific trade lanes represent a resilience risk that a lower contracted rate may not compensate for, particularly during peak seasons or supply chain disruptions. Xeneta Schedules provides blank sailing and schedule reliability data, allowing procurement teams to assess carriers not just on where rates are today, but on whether their operational track record justifies the volume award. For supply chains with low inventory buffers or time-sensitive products, reliability data is often the decisive differentiating factor.
How do I monitor carrier performance post-award?
Post-award carrier monitoring is where many procurement organizations lose the value gained during the tender process: once a contract is signed, performance tracking often reverts to manual spreadsheets and subjective forwarder feedback. Xeneta provides a continuous, data-driven performance monitoring framework, combining rate competitiveness tracking, transit time benchmarks, and schedule reliability scores, that can serve as the foundation for quarterly business reviews with carriers. This creates a structured, evidence-based conversation rather than a subjective performance discussion, and gives procurement teams the data needed to activate contractual remedies or trigger early renegotiation when performance deteriorates.
How do transit time improvements reduce total supply chain cost beyond just freight rates?
Transit time is directly linked to working capital cost. Freight in transit is inventory that has been paid for but not yet generating revenue. Reducing ocean transit time by even two to three days on a high-volume lane can materially reduce in-transit inventory holding costs, in some cases generating more financial value than a 5% reduction in the freight rate itself. Xeneta's transit time benchmarking data allows procurement teams to compare carriers on this dimension and to quantify the working capital benefit of choosing a faster carrier. This reframes carrier evaluation from a purely rate-based exercise to a total-cost-of-ownership analysis that resonates with finance leadership.