See how Nestlé cut manual work, compressed tender cycles, and elevated procurement decisions with real‑time data
Xeneta, trusted by the world's biggest buyers & sellers of containerized and air freight


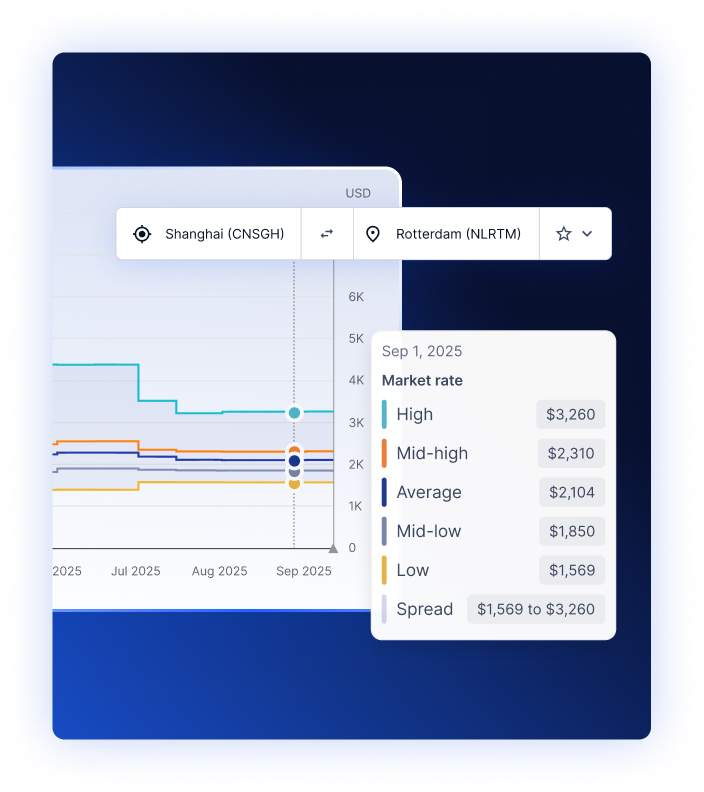
Real-time spot and long-term contracted rates across all major trade lanes.

Full visibility into port, fuel, and carrier surcharges that impact your total cost.

Benchmark D&D charges and identify where costs are climbing before they escalate.

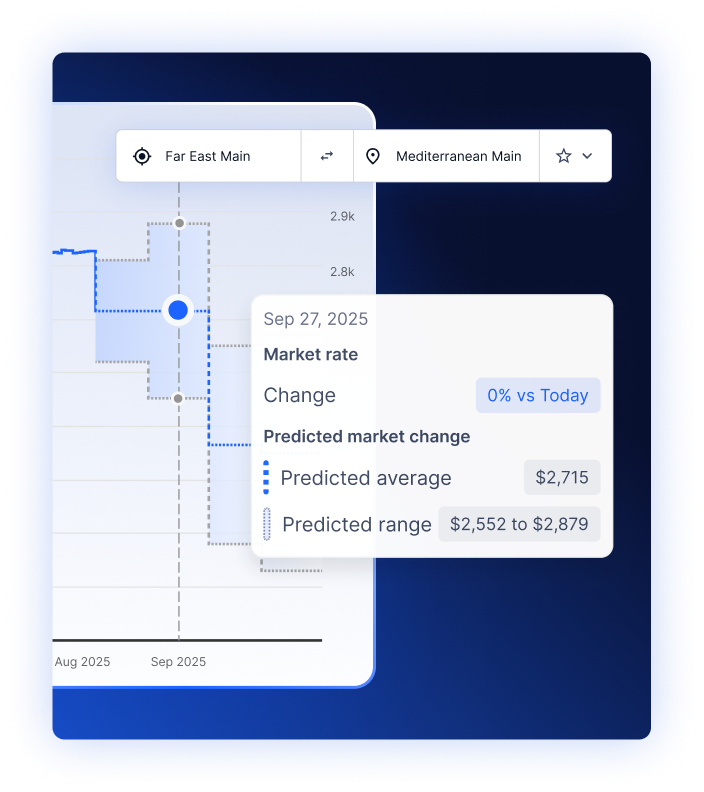
Forward-looking rate intelligence to help you anticipate market movements.

Compare actual transit times by carrier and trade lane to optimise your supply chain.

Track on-time performance by carrier and route to reduce supply chain disruption.

Monitor vessel capacity trends and blank sailings to stay ahead of supply shifts.
Benchmark rates update in real time with 90% data ingested and processed within 1 day.
We validate over 15M ocean and 1M air rates monthly using machine learning and expert review, ensuring accuracy across contracts, container types, and cargo sizes.
Accurate rates for 170k ocean and 60k air lanes, with data on rates, reliability, capacity, load factors, surcharges, emissions, and more across key trades.
Current and future contracted rates booked to 3 months ahead and 10 days for spot rates, and market rate outlooks for key trades, up to 6 months.
700 shipper, airline, freight forwarder and specialist data partners.
ISO 27001:2022 accredited for standards on information security.
Xeneta’s large, accurate dataset enables you to:
Data becomes your advantage — not your uncertainty.
Our data and insight powers freight coverage in the world’s leading media.