
See your supplier network clearly, lane by lane
Build stronger supplier relationships and plan your network with confidence using real market insight.
Trusted by the world's largest
shippers, forwarders, carriers and airlines.












Network planning is limited by incomplete data
Without an objective view, supplier narratives fill the gaps in lane-level insight.
No objective view
Cost, performance and route suitability are hard to compare like for like.
Supplier narratives
Carriers and forwarders tell the story, so real lane insight gets lost.
Blind spots on risk
Network decisions lack clarity on reliability and available capacity.
What if you could see what’s working in your network?
Real-time rate benchmarks, reliability insights and lane intelligence to decide the best routes, suppliers and cargo strategies.
Compare suppliers visual
This page could not be loaded. Please try again later.
See who's priced above the market
Show where incumbents price above what comparable shippers pay, and find credible challengers for your next tender.
Incumbent rates vs live market
Challengers backed by benchmarks
Leverage without going to market
Weigh service visual
This page could not be loaded. Please try again later.
Balance cost against reliability
Combine rate benchmarks with schedule reliability and blank sailings, so you judge suppliers on cost and service together.
Reliability and blank sailings by carrier
Transit time gaps on the same lane
Evidence for paying a modest premium
Plan new lanes visual
This page could not be loaded. Please try again later.
Enter new lanes with a benchmark
Get market benchmarks for lanes you have no history on, so introductory rates don't become your baseline.
Benchmarks before you approach suppliers
Support for nearshoring and diversification
One benchmark across business units
See a supplier network through market data
A Xeneta specialist compares suppliers against the market, weighs reliability and benchmarks a lane with no rate history.
Every network decision built on real market data
Rates shippers and forwarders actually paid, alongside reliability and capacity data, give a neutral view of every lane.
- Contracted rate data points
- 900M+
- Ocean port pairs
- 170k+
- Airport pairs
- 20k+
See how shippers build stronger networks

Rate vs service, rebalanced to 70/30
Hitachi Energy weighs rate against service with Xeneta data across 15,000 TEU a year.
Read the case study
A multi-million dollar cost case
A global automotive manufacturer benchmarks ocean and air across regions and functions.
Read the case studyHear from our customers
How shippers regain leverage in carrier-led markets
Our analysts answer the 48 questions shippers raised at our recent roundtables, so you can go into your next tender with a plan.
Get the report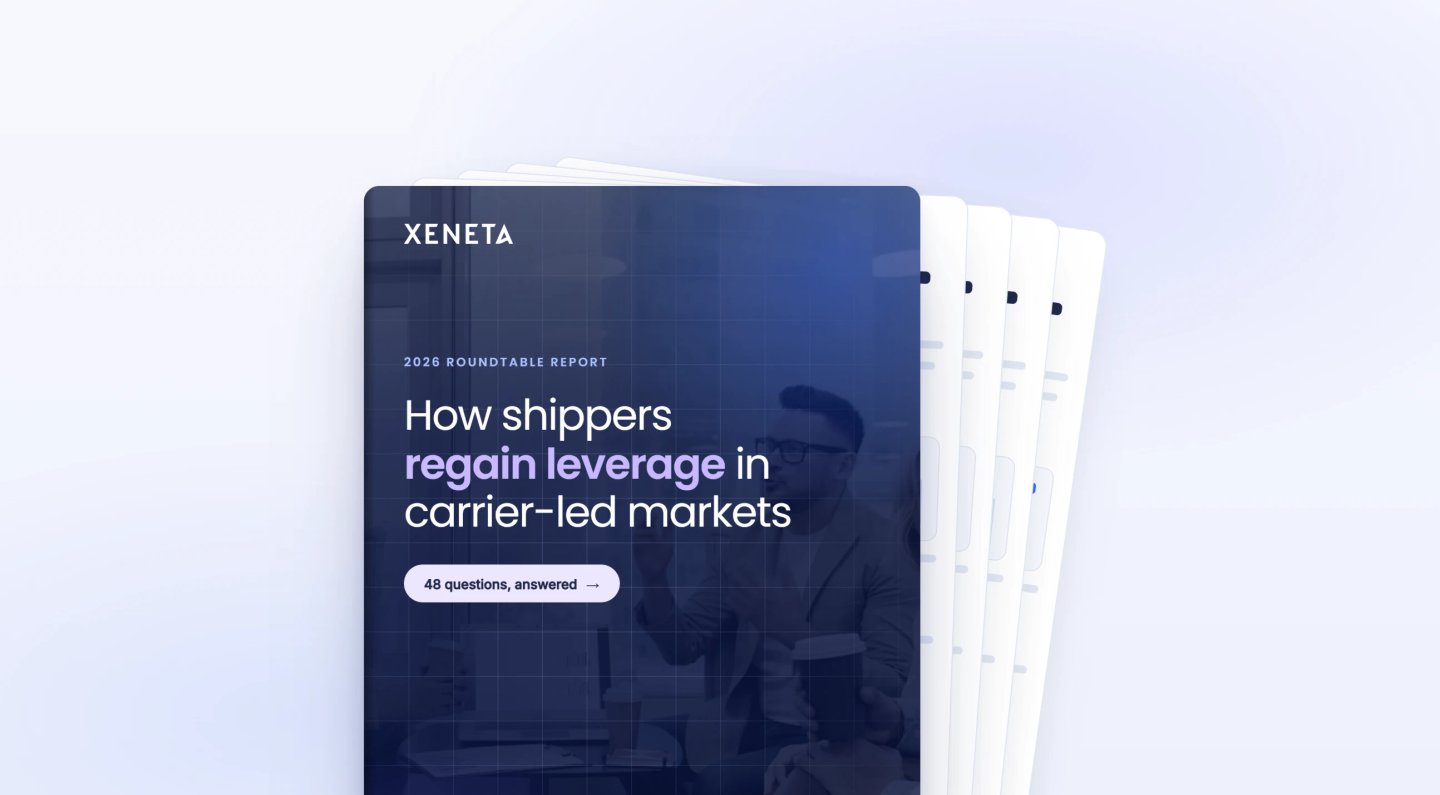
Go deeper on network strategy

Build resilient supply chains
A supply chain masterclass on calibrating your network and mitigating supply risk.
Watch now
Rebuilding trust in carrier performance data
Why carrier performance data breaks down, and how to rebuild a version you can trust.
Watch now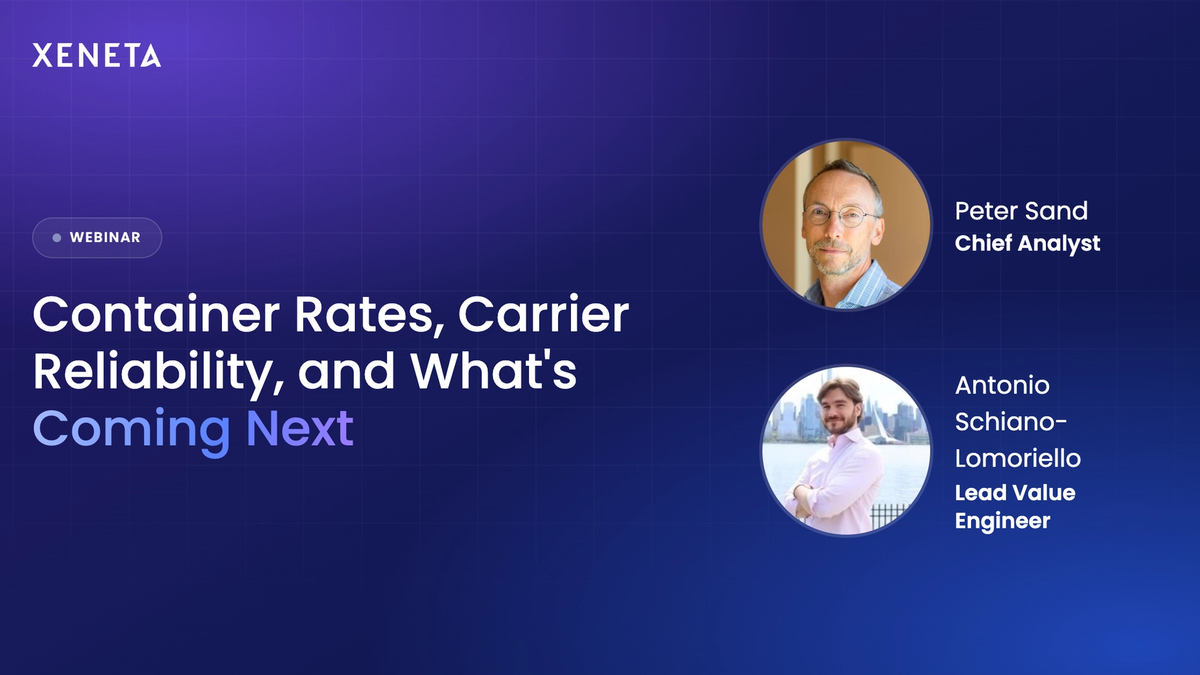
Dry cargo rates and carrier reliability
Benchmarking dry cargo lanes live and comparing carriers on price and reliability.
Watch nowNetwork strategy, answered
How does Xeneta help me decide whether to consolidate volume with fewer suppliers or maintain a broader base?
Volume consolidation is a commercial and resilience trade-off, and Xeneta gives you the data to make it objectively. By showing what rates comparable shippers achieve at different volume levels and on alternative routings, you can model the commercial case for consolidation before committing to it.
The decision goes beyond finding the cheapest rate. Xeneta combines rate benchmarks with schedule reliability and blank sailing data so you're evaluating suppliers on cost and service together. For example, on a lane like China to US West Coast, there can be up to 13 days difference in transit time between the best and worst performing carriers, with a rate difference of around 10%.
For many organizations, paying a modest premium for faster, more reliable service is the right commercial call, whether that means fewer delays, better schedule adherence, or reduced inventory risk downstream. Xeneta gives you the visibility to make that call with confidence rather than defaulting to the lowest rate on the page.
Our Carrier Scorecard brings this to life in a single view, showing exactly how reliable each of your carriers is so you can make consolidation decisions based on the full picture.
How does Xeneta help me identify new suppliers that could challenge my incumbent carriers or forwarders?
Incumbents benefit from switching inertia, they know you're unlikely to move volume without compelling evidence of a better alternative. Xeneta removes that inertia by showing where the market is trading relative to your current contracted rates, making it immediately visible when an incumbent is pricing above what comparable shippers are paying. That market view gives you the basis to identify credible challengers worth inviting to your next tender, and the leverage to push incumbents harder without needing to go to market to prove the point.
How does Xeneta help me build a network strategy for lanes I have no history on?
Entering a new trade lane, whether driven by supply chain diversification, nearshoring, or market expansion, is significantly harder without contracted rate history to anchor your targets.
Xeneta provides market benchmarks for the lanes you're evaluating, giving you a realistic view of what the market is currently achieving before you approach suppliers. Customers expanding into markets such as Latin America, Africa, or intra-Asia specifically use Xeneta to avoid the common trap of accepting an introductory rate that sits well above what informed buyers are paying.
How does Xeneta help me evaluate suppliers on service quality, not just rate?
A network built purely on rate can fail commercially if unreliable transit times drive up inventory holding costs or force unplanned air freight to cover stockouts. Carrier Scorecard integrates schedule reliability and transit time data alongside rate benchmarks, allowing you to evaluate carriers and forwarders on cost and service in a single view. For procurement teams under pressure to move beyond a purely cost-focused mandate, this dual-lens evaluation provides the analytical framework to justify selecting a more reliable supplier and quantify the total cost benefit of that decision for finance stakeholders.
How does Xeneta help centralized procurement teams align multiple business units around a shared network strategy?
Fragmented procurement, where different divisions or regions negotiate independently, leaves significant value on the table and makes it nearly impossible to build a coherent network strategy.
Xeneta provides a single, consistent benchmarking framework that allows a central team to compare performance across business units, identify which divisions are overpaying on shared lanes, and build the case for consolidated volume. A common market benchmark replaces internal disputes about whose rates are competitive with objective, data-driven comparisons and gives the central team the neutral reference point needed to bring business units into alignment.