<img height="1" width="1" style="display:none;" alt="" src="https://px.ads.linkedin.com/collect/?pid=502551789&amp;fmt=gif">
Skip to content
Xeneta for supply chain teams

Route and mode decisions get made on gut feel and last year's data, then disruption forces a costly last-minute scramble.

Xeneta gives supply chain leaders independent lane-level market data, enabling scenario planning, manage risks and make more informed network decisions. 

Trusted by the world's biggest buyers & sellers of ocean and air freight

The reality facing today’s Supply Chain leaders

Freight is no longer a predictable operational input, volatility now directly impacts service, cost, and resilience. Supply Chain teams are under growing pressure to:

Balance cost efficiency with service reliability across volatile trade lanes

Identify emerging risk and adapt networks before issues hit operations

Build resilient supply chains while aligning procurement, logistics, and finance

Yet freight data is often fragmented, lagging, or anecdotal, making it difficult to understand true market exposure versus operational decisions.


This is where Xeneta provides clarity.

sbd_logo


“Xeneta’s data coverage matches more than 95% of our port pairs globally. That gives us a consistent view of the market across both core and regional trades, and a single source of truth for our global supply chain.”

 
David Lenaers, Global Director of Logistics Sourcing


View more case studies


How Supply Chain teams use Xeneta

Get a single source of freight intelligence

bullet
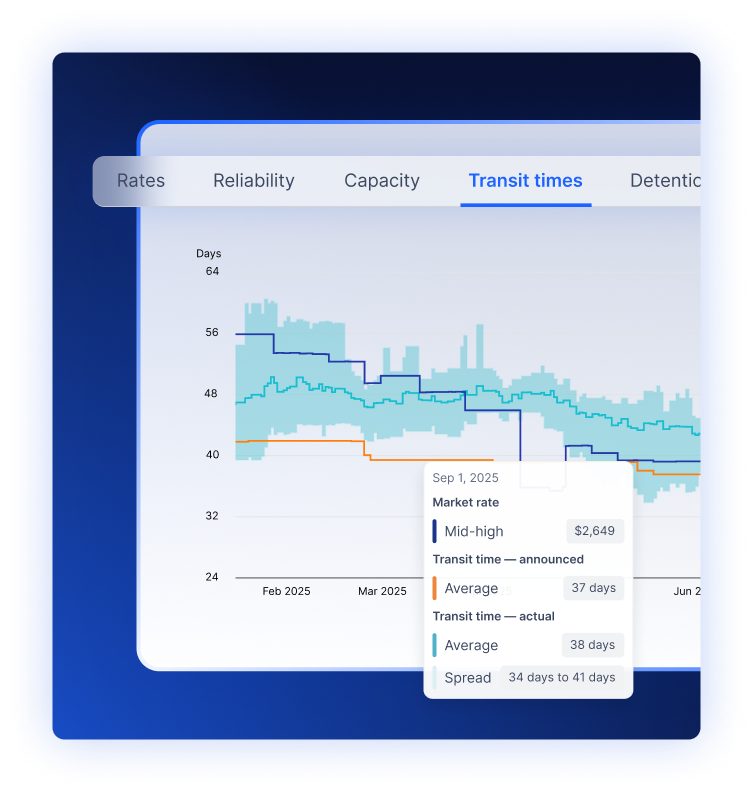
Compare and review contracted rates across lanes and regions
bullet

End-to-end visibility across your freight costs

bullet

One shared platform across Finance, Procurement, Logistics and Supply Chain
Ocean_Product5
Supply Chain Masterclass

Build resilient supply chains. Calibrate the network. Mitigate risk.

A 45-minute platform masterclass for supply chain leaders turning freight from an unpredictable input into a controllable one. See how to read market exposure by lane, stress-test the network, and align the wider team on one source of truth.

  • 1See your exposure by lane. Read how volatility is moving cost and service across your trade lanes and regions, not just the headline index.
  • 2Stress-test the network. Model cost and service trade-offs and pressure-test routing and carrier strategies before you commit.
  • 3Align on one source of truth. Give procurement, logistics and finance the same neutral market view, so network decisions hold up under scrutiny.

Hosted by Peter Sand, Chief Analyst, and Chaitanya Kulkarni, Product Manager, at Xeneta.

On-demand webinar
  • FormatOn demand, watch anytime
  • Duration45 minutes
  • What you'll seeFull platform walkthrough, real scenarios
Watch on demand

800M+ anonymised freight rates · 170,000+ port pairs · $608B+ in freight spend.
Independent of carriers.

Why Supply Chain teams rely on Xeneta

With 800M+ anonymised freight rates across 170,000+ port pairs and over $608B in tracked freight spend, your network decisions rest on an objective view of the market.

Plan routes on real data

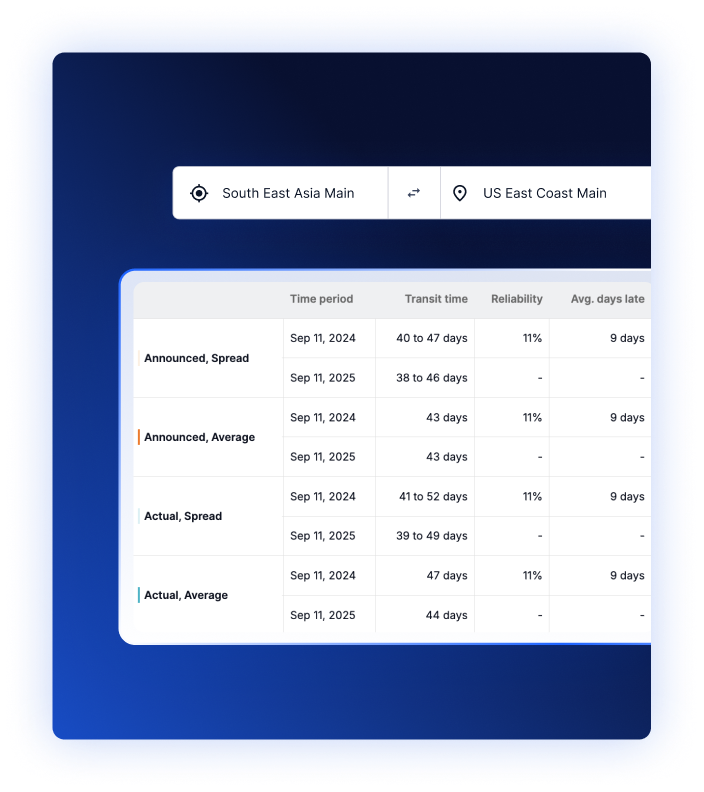
See rates, capacity, and reliability across corridors before you commit.

Switch modes with confidence

Cross-modal benchmarks make ocean↔air shifts planned, not panicked.

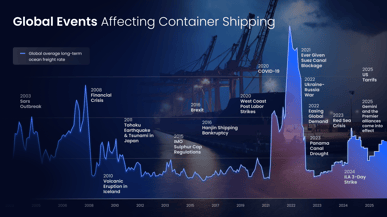
Spot disruption early

Always-on monitoring and alerts on rate spikes and capacity crunches.