Freight procurement has always been more than a desk job. It’s built on phone calls, handshakes, and relationships forged over years of navigating uncertainty together. When a crisis hits, those relationships are often the first call you make. That trust is real, and it has real value.
But trust alone doesn’t protect your P&L when a port grinds to a halt or a geopolitical shock sends spot rates into freefall overnight. That tension sits at the heart of Xeneta’s 2026 Freight Report — and was also explored in a recent webinar hosted by Eloisa Tovee, Senior Campaigns Manager, and Bjørn Vang Jensen, Executive Industry Advisor, who has lived through every one of the disruptions he discusses from his time as a beneficial cargo owner (BCO).
Continue reading for the key takeaways — or jump straight to the full report if you'd rather start there.
Disruption has shifted from Permacrisis to Polycrisis
The disruption timeline below speaks for itself.
Since 2020, freight teams have absorbed COVID-19, the Ever Given blockage, the Ukraine-Russia war, the Panama Canal drought, the Red Sea crisis, a US East Coast port strike, a wave of tariffs — and now a fresh Middle East escalation.
These aren't isolated events with clean recovery windows.
They stack.
Their effects ripple across modes, regions, and networks in ways that are difficult to model, let alone price in advance.
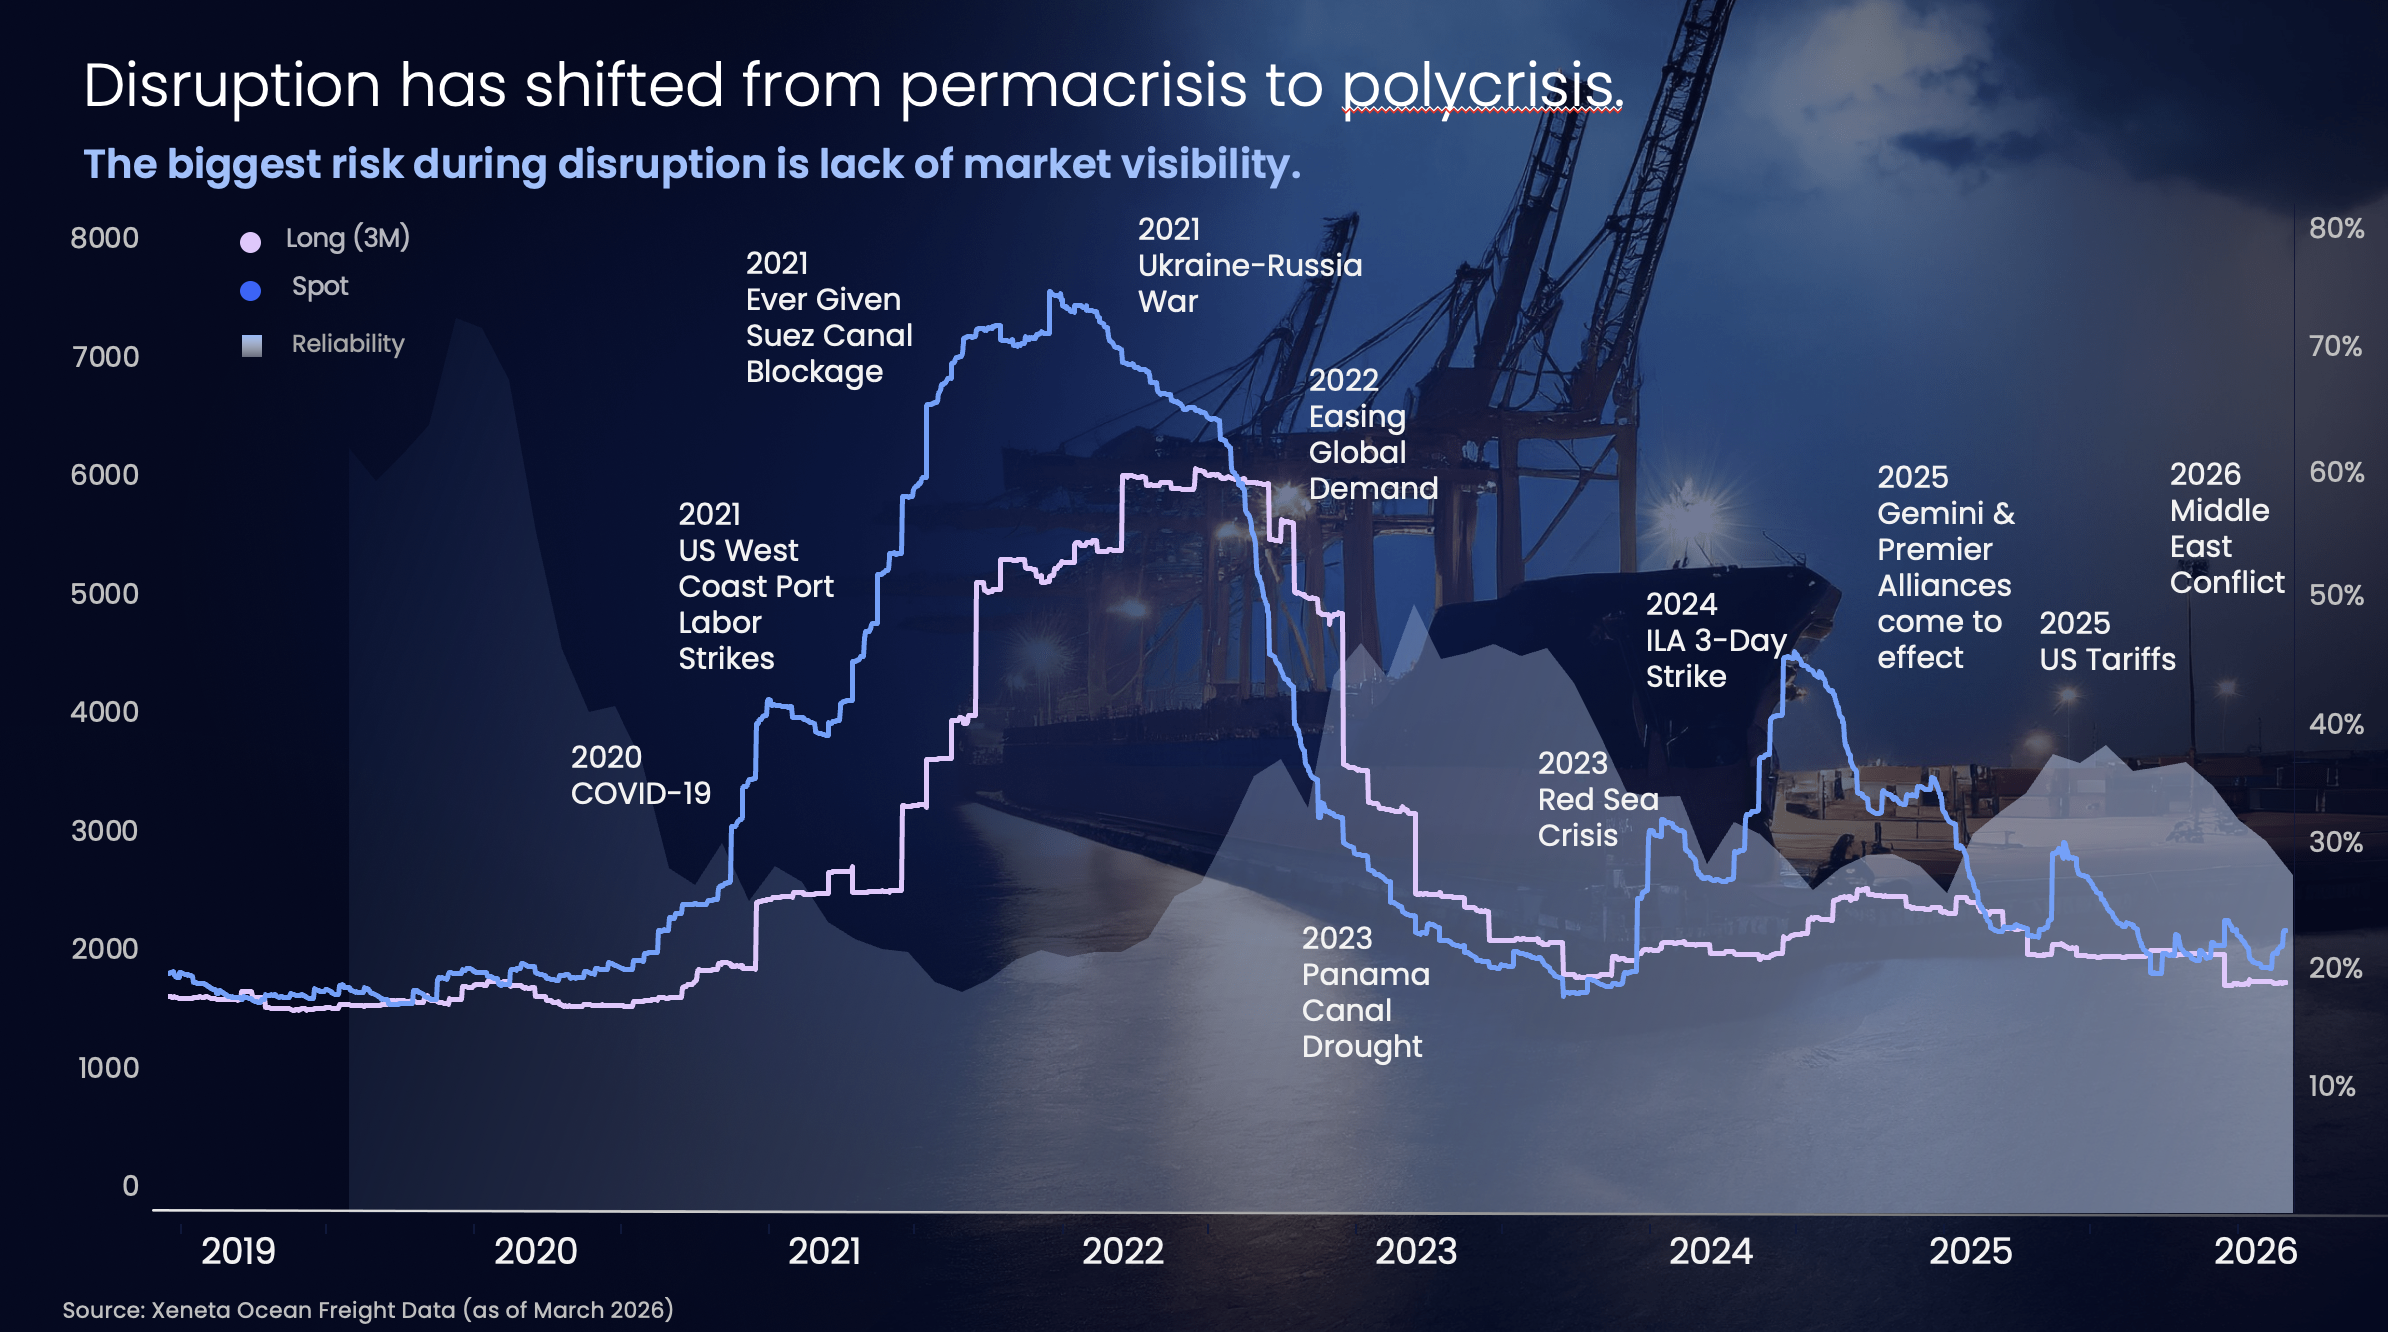
Bjorn's framing is precise: the industry has moved from "permacrisis" to "polycrisis." Multiple disruptions are now hitting simultaneously, and each one distorts the market for everyone — shippers and carriers alike.
This market reality became the starting point for the 2026 Freight Report research. Xeneta, in partnership with Vanson Bourne, surveyed 450 procurement and supply chain decision-makers globally — over 85% in senior leadership roles at organisations of 500 or more employees — to understand how shippers are responding to this new era of disruption, which strategies are proving most effective, and whether the industry is holding to its relationship-first roots or shifting toward data-driven solutions.
Before we jump in, one important consideration is timing: the survey was completed in November 2025, with the team spending a short period afterward drawing out the key insights before making the results publicly available. While we may now interpret the findings through today’s lens, respondents themselves were operating in a very different context. For example, the Strait of Hormuz did not emerge as a likely 2026 agenda item until several months after the survey closed.
With that context in mind, here's what the data revealed.
The $4 Million Figure — and What It Potentially Hides
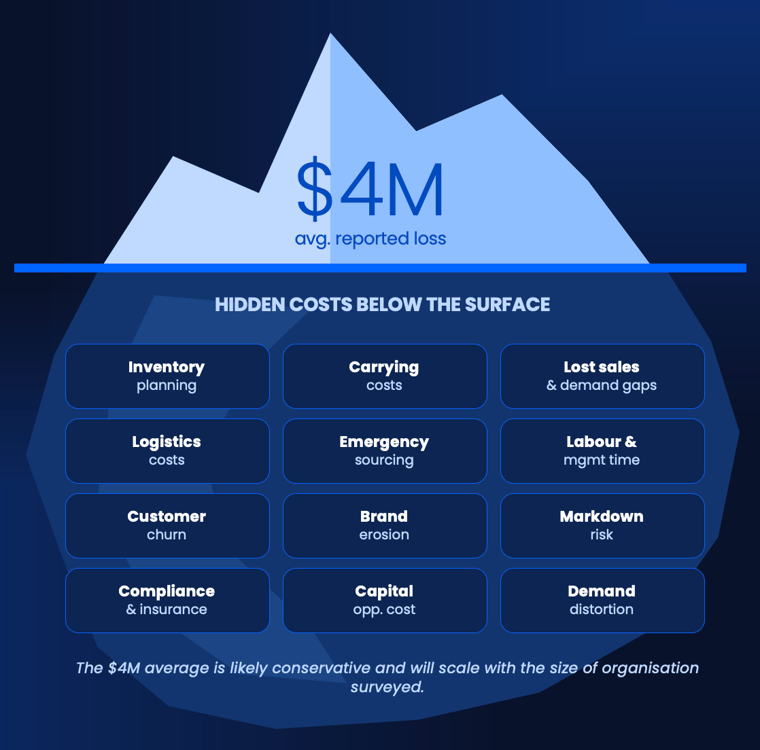
When respondents were asked to estimate the financial impact procurement and supply chain disruptions had on their business in 2025 alone, the average reported loss came in at approximately $4 million.
That number is significant. But Bjorn is clear: it's almost certainly conservative.
Almost a third (32%) reported loses between $2-5million. More than one in five organisations (21%) reported losses between $5 million and $10 million. While six percent estimated losses between $10 million and $20 million — all directly tied to supply chain disruption.
Real-world examples help illustrate the scale. During COVID-19, Nike saw gross margins fall to 37.3% in Q4 FY2020, as factory cancellation charges, obsolescence reserves, and fixed supply chain costs hit a business already dealing with wholesale shipments down nearly 50% and around 90% of company-owned stores closed for approximately eight weeks.
In January 2024, Tesla planned a temporary production halt at its Gigafactory Berlin due to Red Sea shipping delays. With the facility producing roughly 4,000 vehicles per week and estimated profit per vehicle of around $8,000, the potential lost profit reached approximately $64 million.
UK retailer Next also reported a £15 million short-term cost impact linked to fuel, air freight, and sea freight disruption caused by instability in the Middle East.
These are not edge cases — they are examples of what happens when disruption hits companies without sufficient visibility to anticipate it or the data to respond quickly.
It's entirely possible that some teams only experienced marginal, contained losses over the past 12 months. But that perspective can be misleading in financial terms.
Many disruption costs never fully land within procurement budgets, instead surfacing across operations, inventory, customer service, sales, and finance — and only becoming fully visible in hindsight as they work their way through the P&L. The hidden costs — inventory build-ups, working capital strain from extended transit times, emergency re-sourcing premiums, management time diverted into firefighting, lost sales, customer churn, and markdown exposure on late arrivals — are therefore difficult to isolate at source.
In many organisations, those impacts don’t disappear; they are effectively redistributed. They move downstream into the remit of other finance and commercial teams, who are then asked to absorb the pressure and deliver savings to close gaps created upstream by disruption — a dynamic Bjørn Vang Jensen illustrated from his own experience inside a manufacturing environment:
“So often when these things hit — when the logistician comes and says, I’m really sorry, there’s this pandemic and now we’re going to have to pay $20,000 for a container from Shanghai to Chicago that used to cost $3.5 or $4 thousand — then the controller says, what’s the impact of that?
Well, everything else being equal, and we estimate this will last six months, the impact is going to be $5 million.
The next thing the controller will do is go to all the other owners of these potential parts and say, right, I need you to find $5 million in cost savings so that we can offset the rates.
And then the whole apparatus swings into action.
The direct material and indirect material procurement people will start looking at cheaper or alternative suppliers. The packaging engineers will start asking, can we use one-fifth of a millimetre thinner cardboard? Can we move to reusable packaging? What can we do with scrap? Can we reduce waste?
Everybody starts going, ‘OK, if everybody somehow comes up with a 2% cost reduction on their P&L, we can cover for the logistics guy.’
So that’s why these remain unseen, because not everybody has the full overview.”
That full overview is precisely what most procurement teams are missing — and the market isn't know for waiting for BCOs to catch up.
56% Describe Themselves as Relationship-First — and are Paying for It
This is where the research gets a little uncomfortable.
The industry’s relationship-first model exists for good reason: logistics organisations have spent decades building trusted networks that kept supply chains moving through every kind of disruption. When a model consistently delivers resilience, there is little incentive to question it.
But the data surfaces a clear tension.
Today, 56% of respondents describe themselves as mostly or entirely relationship-first — relying primarily on trusted partners rather than independent market intelligence to validate pricing, performance, and risk. The US and APAC are the most relationship-oriented markets. A further 32% take a balanced approach, while just 12% identify as mostly or entirely data-driven.
Those same relationship-first organisations also reported materially higher disruption losses than their counterparts, with 36% experiencing losses between $5 million and $20 million, compared to 14% among balanced organisations and 20% among more data-driven teams. At the same time, 42% of all respondents cite over-reliance on long-standing partners as a direct challenge.
The point isn't that relationships don't matter — they do. But they don't determine negotiating position on their own.
Freight is not a stable commodity market. It swings between shipper-friendly and carrier-friendly conditions, sometimes rapidly and rarely with much warning. A shipper without an independent view of where rates sit enters every carrier conversation at a disadvantage — whether that's during a calm market or when capacity tightens overnight.
That's why the data shows a meaningful shift on the horizon.
When asked where they expect to be in five years, the relationship-first share barely moves — falling only from 56% to 54% — but the balanced category drops sharply, from 32% to 12%, while the data-driven share nearly triples, from 12% to 34%.
Teams are not abandoning relationships; they are increasing the role of data alongside them. And while balanced organisations currently report the lowest disruption losses, the direction of travel suggests many teams believe greater market visibility and benchmarking will become increasingly central to procurement decision-making over the next five years.
The most likely explanation is lived experience. Teams that have navigated COVID, the Red Sea crisis, and now fresh Middle East disruption in close succession have seen, in concrete financial terms, what operating without market visibility costs. That tends to change procurement priorities faster than any technology roadmap.
And that matters because the contract landscape has evolved alongside how freight exposure is actually managed.
Annual tenders still anchor most procurement strategies, providing predictability and continuity, but they no longer define total exposure. As freight markets move faster than a single annual cycle can capture, spot buying and shorter-term agreements now account for a meaningful share of volumes – with just over a third (36%) of respondents noting an increase in use of spot market rates or short-term capacity bookings. This means procurement teams are managing a growing number of negotiations alongside annual tenders.
Without an independent benchmark, those negotiations risk being guided by counterpart signals and lagging price indicators rather than a current view of the market.
And when controllers are asking teams to find 2% in savings, benchmarking is often the first place they look to identify where that headroom actually exists — making it not just a negotiation tool, but a starting point for cost action.
Closing the Visibility Gap: Four Moves to Make Before Your Next Negotiation
The webinar closed with four concrete recommendations for procurement teams looking to turn the research findings into action:
-
Establish a market baseline before the next tender. Internal data tells you what you paid. External benchmarks tell you whether what you paid was right. Without that context, you're negotiating without a reference point.
-
Move from annual to continuous procurement. Spot market exposure and surcharge volatility mean the market moves faster than a once-a-year tender cycle can capture. Building a rhythm of regular market monitoring — watching contracted rates, spot rates, and surcharge movements in parallel — gives teams the agility to adjust mid-cycle rather than absorb the cost at year-end.
-
Align procurement and finance on a single view. When teams are working from different data sets, decisions slow down and costs get attributed inconsistently. A shared view of rates, performance, and cost creates the common language needed to respond to disruption quickly — and to justify decisions to leadership.
-
Build carrier scorecards that go beyond price. How a carrier behaves under pressure — communication quality, pricing transparency during disruption, reliability when capacity is tight — matters as much as their standard rates. That behaviour should inform future sourcing decisions, not just the contract terms at signing.
Final thoughts
The past six years have made one thing clear: disruptions are compounding, increasingly hard to predict, and virtually no organisation is immune. The 2026 Freight Report puts a number on it — 96% of organisations experienced moderate or significant disruption in at least one area in 2025 alone. The ones that fared best aren't necessarily those with the longest-standing carrier relationships or the most aggressive tender strategies. They're the ones who had access to data precisely when the market moved, and to a community of peers sharing intelligence in real time.
The $4 million average in this research is a starting point, not a ceiling. And for most organisations, the gap between what disruption costs and what it needs to cost comes down to a single question: are you working from your partners' view of the market, or your own?