



.png?width=1200&name=freight-ship-reliability%20(1).png)
Q2 2026: A Massive Recovery, With a Gulf-Sized Exception
Global on-time performance hit 39% in May, the third consecutive monthly gain from 36% in March and 37% in April. This was the closest reading to the 40% ceiling we've seen since December 2023. Average delay also fell to 3.4 days, the lowest since July 2025. June checked our collective optimism; no trade improved, on-time arrivals fell −2pp to 37%, and delay crept back up to 3.6 days. The global recovery is real, but the momentum just stalled.
.png?width=901&height=540&name=global-reliability-chart%20(6).png)
Shippers remain susceptible to how strict capacity management is influencing already volatile rates, but global blanking shows signs of easing into Q2. It fell to 9% of planned TEU in June (890k TEU), coming in below its 2025 counterpart, with June 2025 at 12%.
Trade and Alliance: Who's Actually Recovering
East Coast South America led Q2 at 54% on-time, a +17pp jump against Q1, and the single biggest improver of any trade. West Coast South America followed close behind at 48%. Far East–Europe revealed the second-largest jump (+14pp to 39%), while Far East–North America and Europe–North America each gained +7pp. The Middle East was the obvious exception; on-time arrivals fell in May even as every other trade improved, and the trade closed Q2 at just 25%.
.png?width=901&height=540&name=trade-lane-otp-chart%20(4).png)
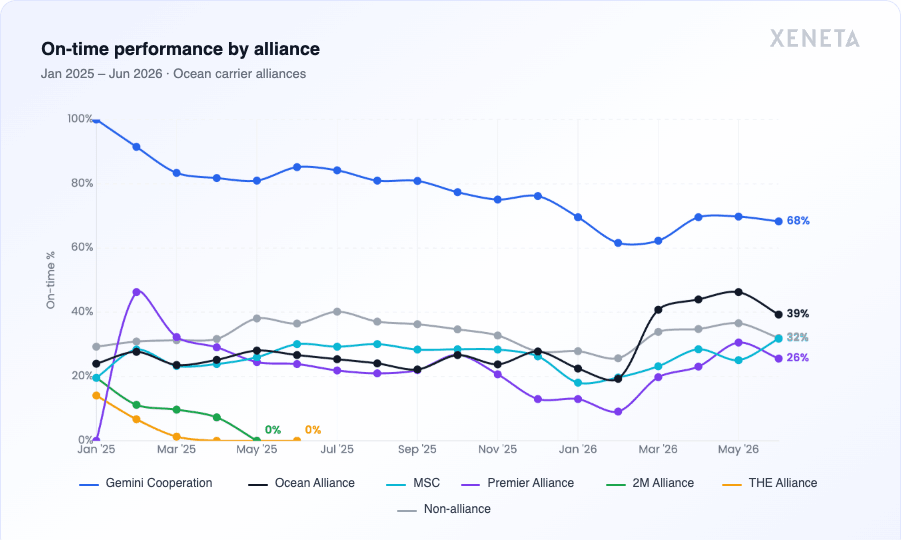
Among alliances, Gemini Cooperation remains in the lead with a 69% Q2 average and 1.1 days of average delay. Ocean Alliance boasted the sharpest and perhaps most surprising turnaround of any network, with a +15pp lift to 43%. Blank sailing discipline remains a structural differentiator; Gemini's well-documented avoidance of blank sailings underpins its consistency while making month-on-month gains appear more modest against peers. Networks leaning harder on capacity withdrawal can flatter their on-time numbers, but other metrics like chronic delays can reveal more of the operating reality.
Structural changes played a role on the transpacific too — China–USWC sailings are now landing nearly 4 days ahead of published transit times. See the full report for which lanes are seeing real improvements versus schedule padding.
Carriers: A 43-Point Spread
Maersk (58% Q2 average) and Hapag-Lloyd (57%) lead against third runner up CMA CGM (46%) by more than 10pp. The Gemini partners both held steady with minimum ground lost in June alongside ONE, Wan Hai Lines, and HMM, while most other carriers declined significantly. ZIM and MSC marked two June outliers, both improving by 2pp. Maersk achieved the largest Q2 recovery overall (+10pp to 58%) alongside HMM (+10pp, 26%), while Wan Hai Lines was the only carrier to fall against Q1 (−6pp to 15%).
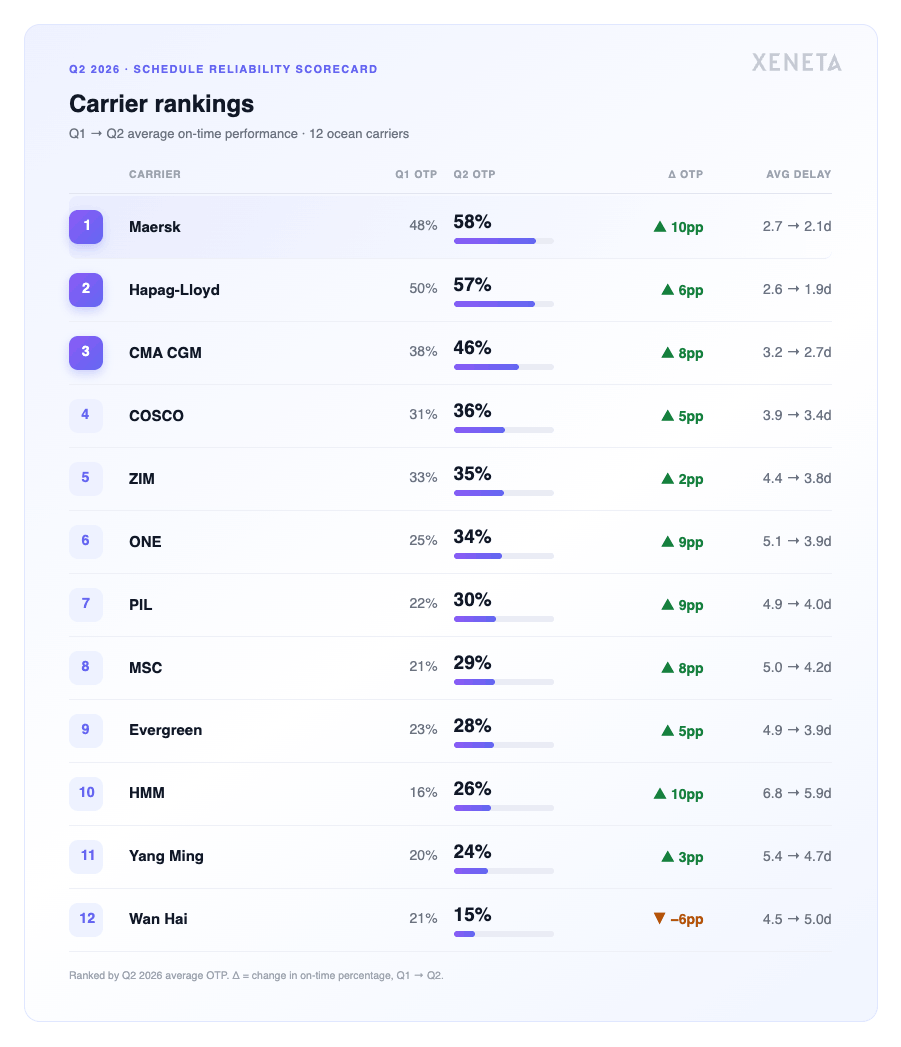
Carrier averages set the scene, but reliability is won or lost at the service level. Xeneta's Carrier Comparison Scorecard shows how specific services perform on your lanes, so you can contract on evidence, not reputation.
Congestion: Ranked by Wait Time, Not Ratios
Ranked by average vessel wait time rather than how many ships are simply queuing, Q2's regional congestion story centers around Africa (3.1 days), Indian Subcontinent (2.6 days), and Southeast Asia (2.3 days). The Middle East is understandably the headline disruption of 2026, but it drops out of the top 3 once Jebel Ali is excluded. The effective closure of the Strait of Hormuz saw vessel counts at this hub collapse from roughly 24/day to 2/day, with trapped vessels using Jebel Ali as a waiting room rather than an actual destination.
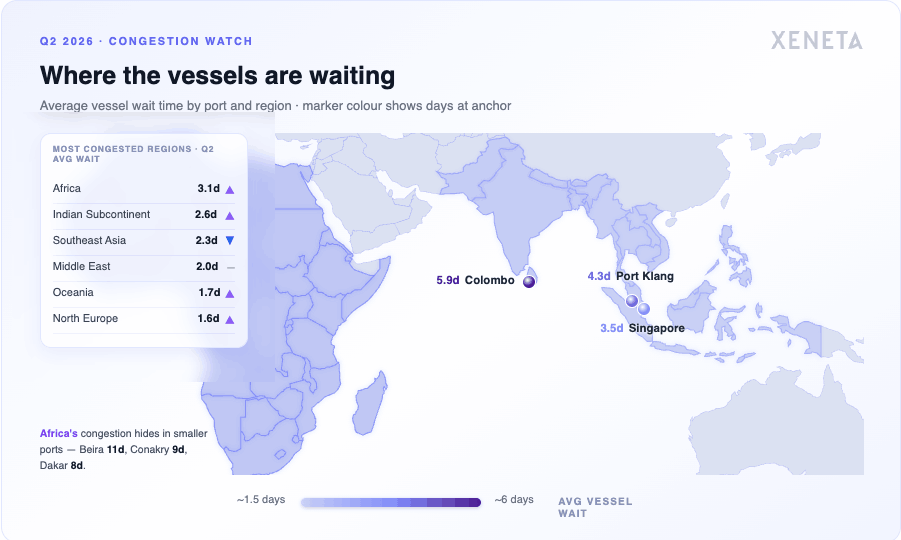
Where congestion is building shifts week to week across 1,000+ ports. Xeneta's Congestion Heat Map tracks it live, and the full regional and port analysis will be available in our upcoming Reliability Advisory report.
This is the condensed view. The full Q2 2026 Schedule Reliability Scorecard — complete trade, alliance, and carrier rankings, transit-time deep dives, and regional congestion analysis — will be available to Xeneta customers through Advisory reports.