




Global reliability deteriorates sharply ahead of peak season demand
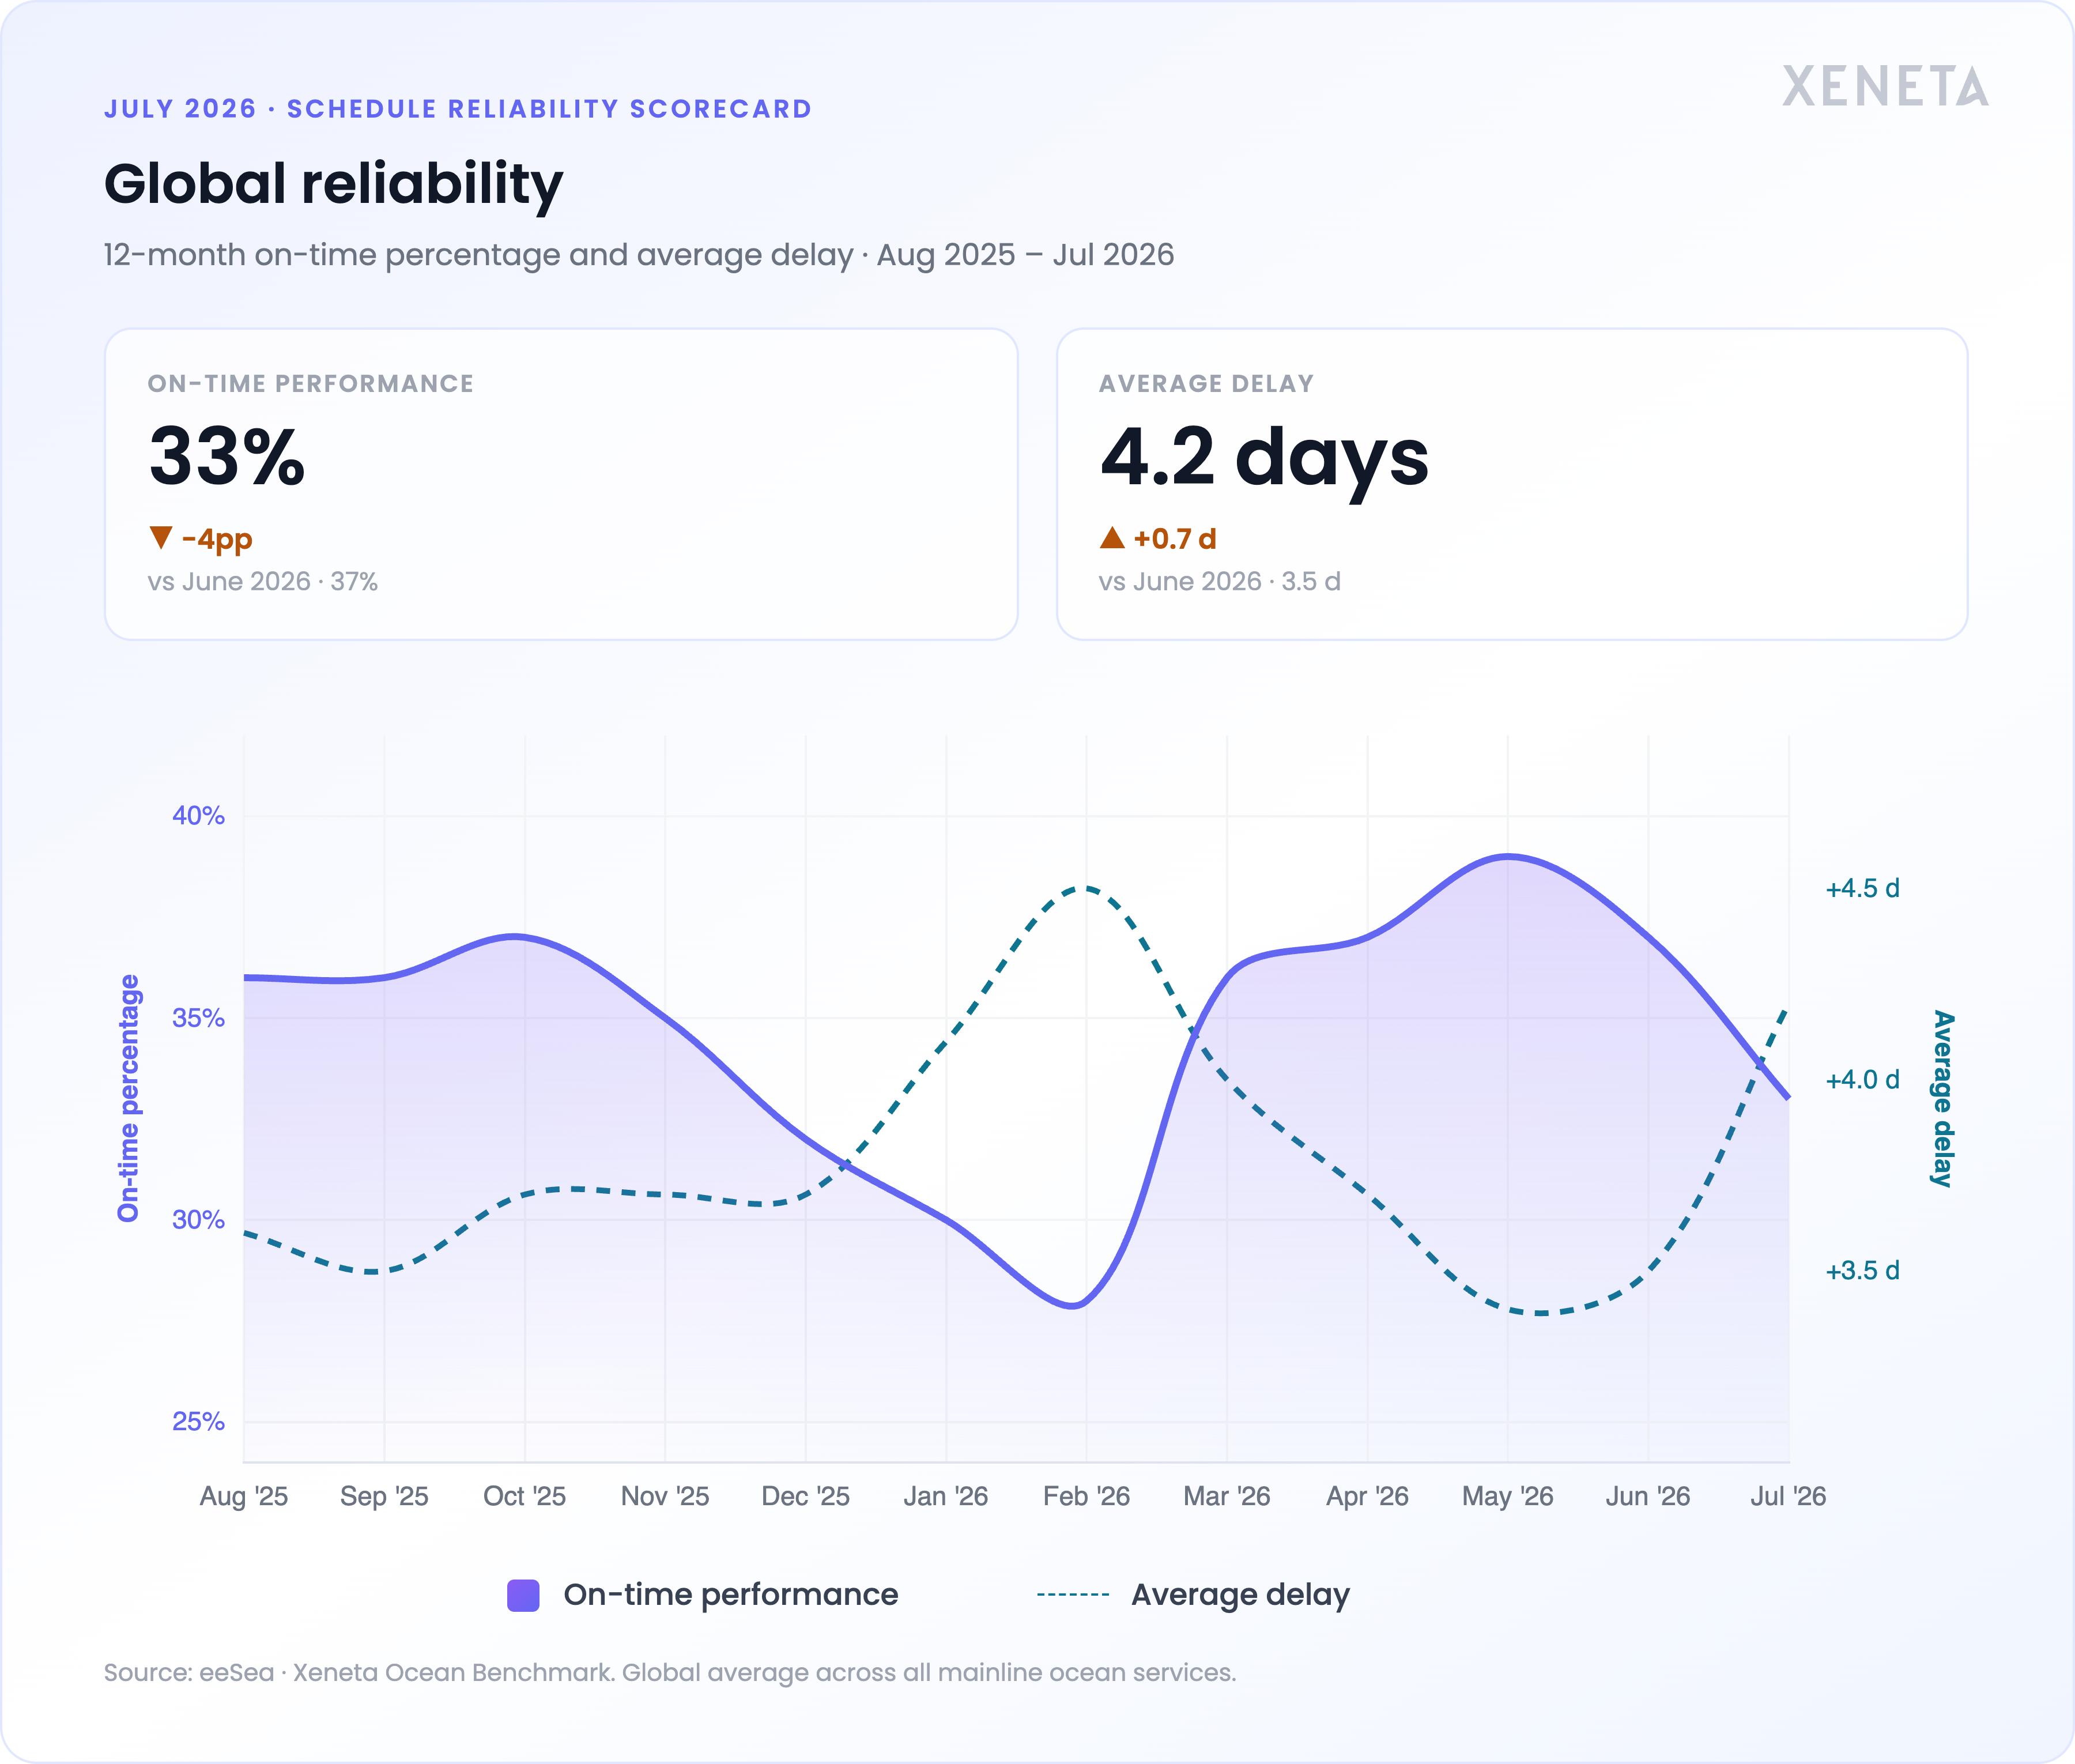
Global reliability declined for the second month running in July, bearing the weight of persistent pressures down on schedules that saw genuine improvement in trades like Far East to North America in Q2. A drop of -4pp to 33%, on the heels of -2pp in June, has erased half of the hard-won recovery that lifted reliability from February's pit (28%) to the May's peak (39%) in the first half of the year
Average delays saw a corresponding jump from +3.5 to +4.2 days late. We are not only seeing more vessels arriving late, but the severity of that lateness is gaining momentum.
Carriers: Performance decline is gaining momentum
The spread between the best and most risk-prone carriers grew even wider in July, from 44pp in June to 49pp.
Strikingly, all carriers in the rankings excepting ZIM (+1pp) dropped between 2 and 13 percentage points, with HMM (-13pp to 14% on-time) marking the extreme end of this decline.
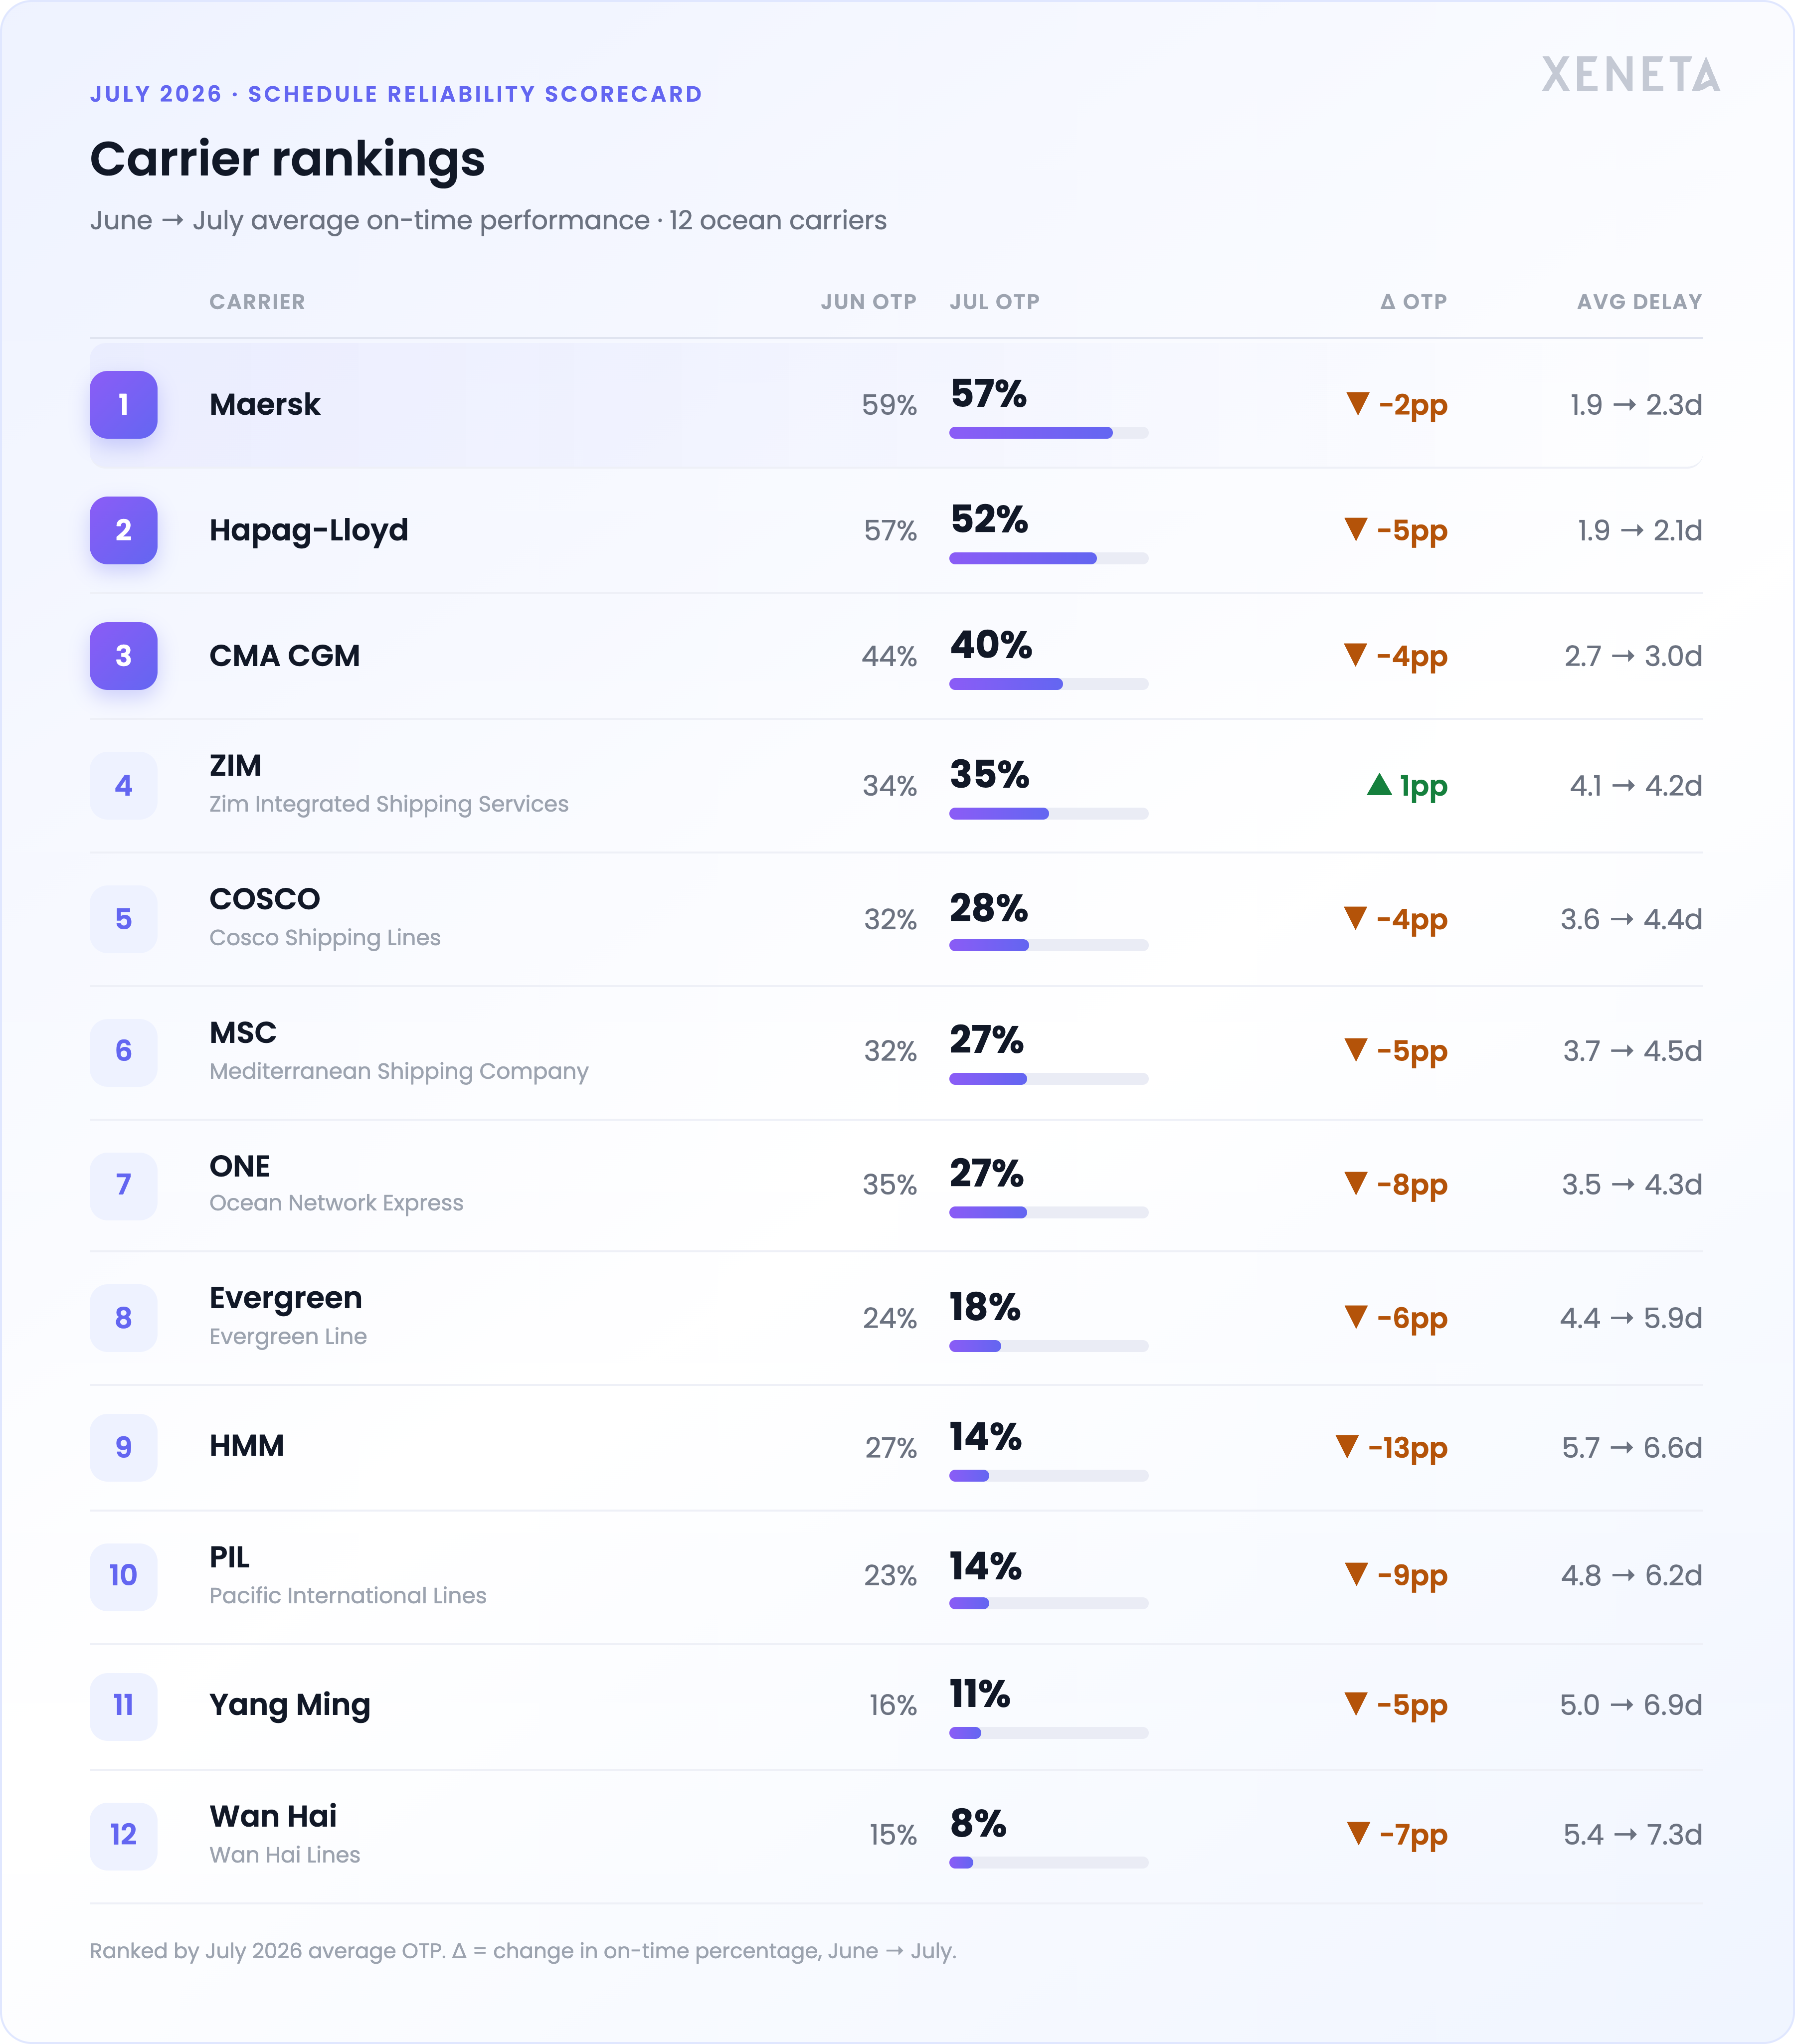
Headliner Maersk continued to sit firmly in the lead but dropped -2pp against June to 57% of arrivals on-time, while Gemini partner Hapag-Lloyd saw a more significant decline of -5pp to 52% on-time.
Wan Hai brought up the very bottom of the rankings with just 8% of vessels on-time and a +1.9 day increase to an average +7.3 days of delay this past month. This marks the lowest monthly performance for the operator over the past 5 years of data.
In both June and July, the typical per-carrier decline ran between 2 to 9 points, marking consistent deterioration across most of the top 12 carriers.
Carrier performance is as mutable as the geopolitical composition of your lanes, and reliability can yield superficial positive results boosted by blank sailings.
For the most accurate and timely information on who to ship with on your port pairs, Xeneta customers can use Carrier Comparison Scorecard and Advisory expertise.
Port Congestion: Africa in the lead but queue times in Europe are rising fast
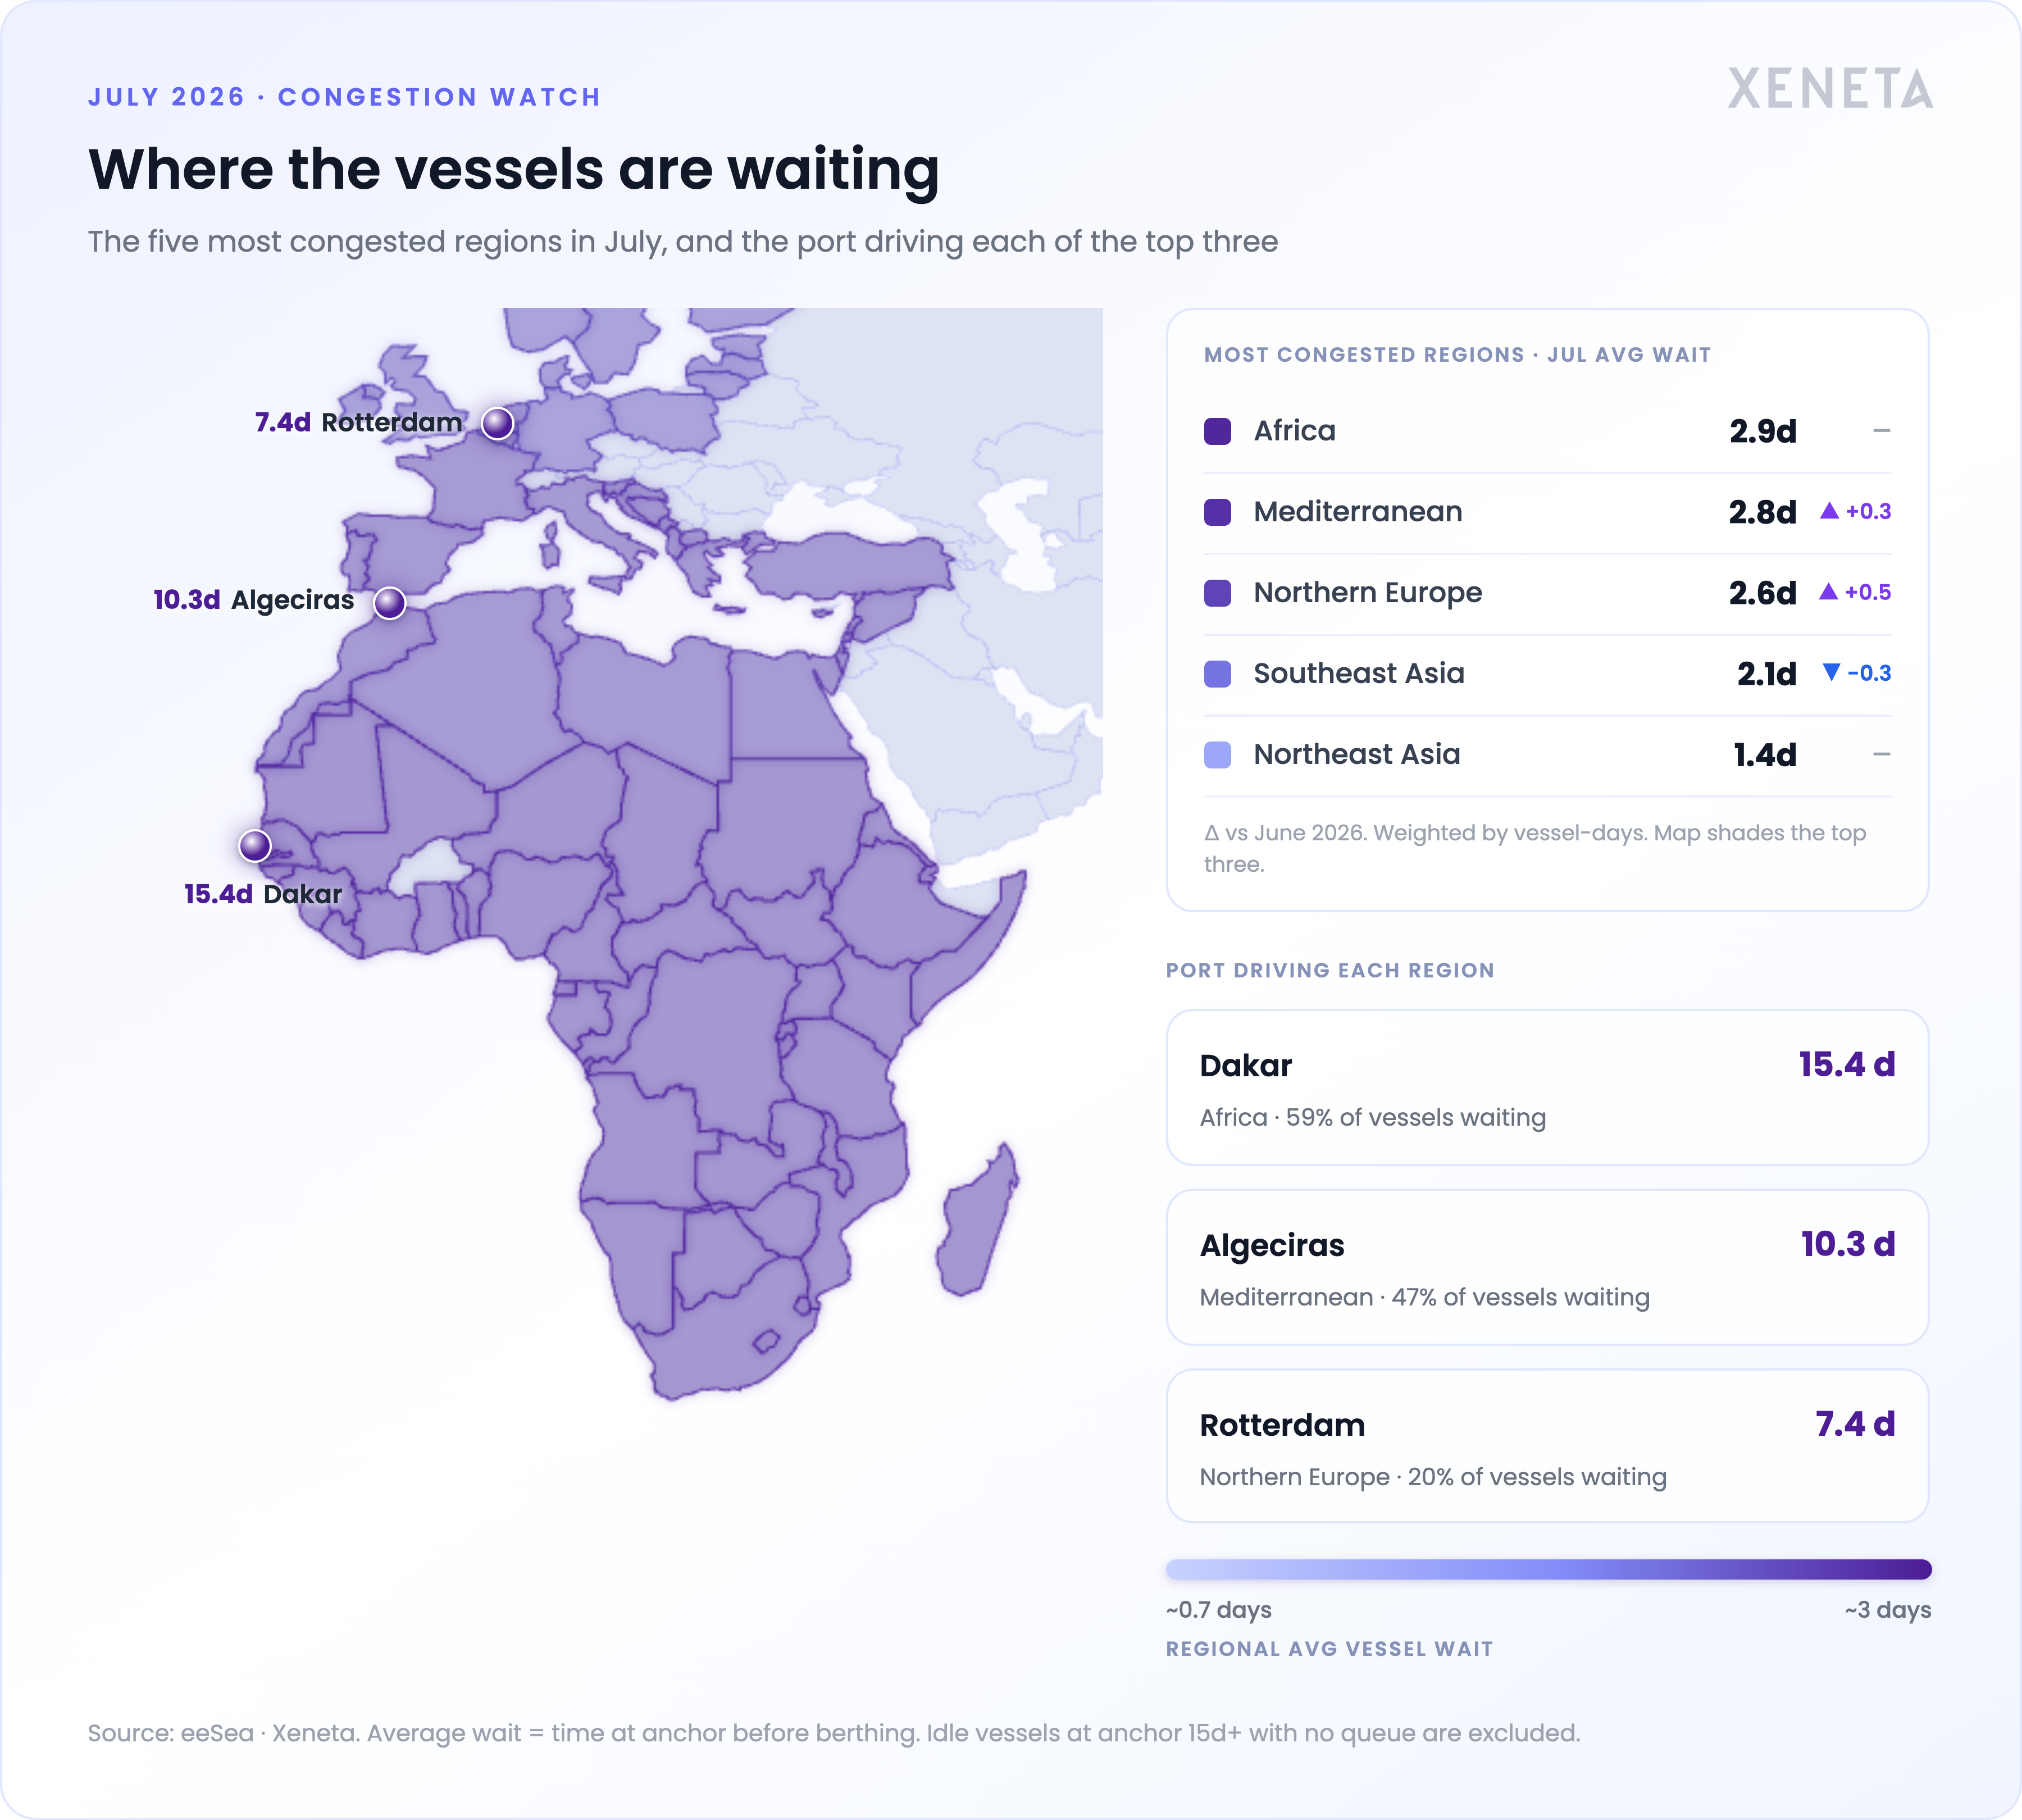
Ranked by average vessel wait times, Africa (2.9 days) leads the most congested rankings in July but is followed closely by the Mediterranean (2.8 days). Northern Europe (2.6 days) has moved rapidly in the rankings from sixth place in May to third, taking on an additional +1.2 days of average vessel wait time in the past two months.
Critical gateways Algeciras (10.3 days) and Rotterdam (7.4 days) point to localized wait times running well above their regional averages and contributing to both direct and transshipment arrival delays into Europe.
Where congestion is building shifts week to week across 1,000+ ports. Xeneta's Congestion Heat Map tracks it live.
This is a high-level look at monthly reliability rankings. Xeneta provides complete trade, alliance, carrier, and service level performance updated daily with a 90-day forward window -- along with the reasons behind the trends. Reliability measures available to customers include on-time percentage, delays, cancellation rates, transit-times, and congestion.