



The Xeneta Weekly Ocean Container Shipping Market Update provides data and intelligence including the latest freight rate and capacity movements across global trades with supporting insight from Peter Sand, Xeneta Chief Analyst.
Xeneta Analyst Insight: Rates start to tumble from Far East to US East Coast following record-breaking capacity in October
Peter Sand, Xeneta Chief Analyst:
Far East-North Europe:
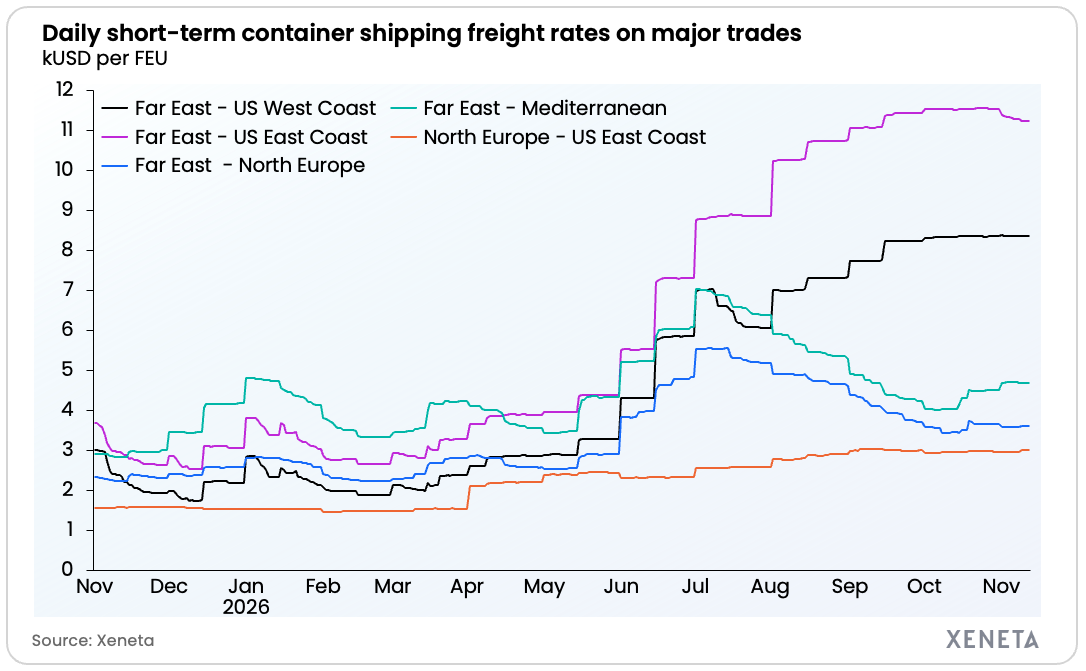
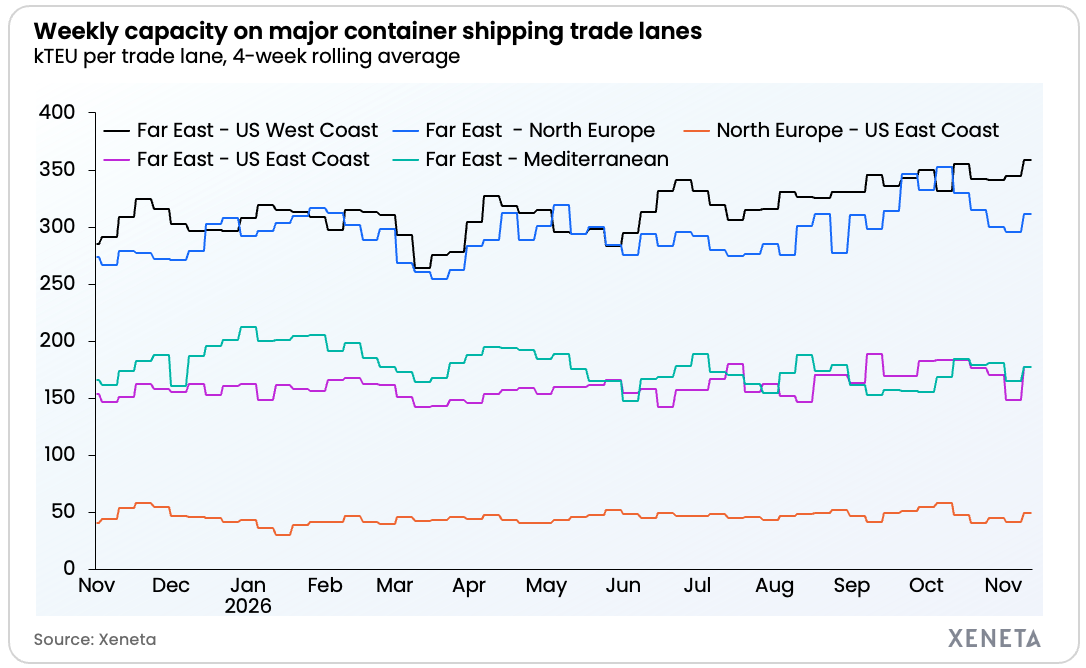
“Carriers tightened capacity on the Far East to North Europe trade from mid-October to early November, with offered capacity dropping by more than 10%. It had the desired effect with short-term rates moving higher on 19 October, but gravity always wins and a downward trend and has returned.
“Demand is easing somewhat in the final six or seven weeks of the year so gravity will get stronger. To avoid faster falling short-term market rates, carriers need to keep a close eye on deployed capacity, which probably means doing what they already did in October and many times before – blanking sailings."
Far East-US East Coast:
“Average monthly offered capacity from Far East to US East Coast hit an all-time-high of 179,000 TEU per week in October - up 10.9% compared with a year ago. Carriers were using this record capacity to capitalize on elevated rates, but the tables are now turning with the peak reached on 22 October and average spot rates falling 2.5% since then.
“For shippers in the middle of tendering, or just about to dip their toe into round one, these are important insights. The Xeneta Ocean Outlook 2027, published this week, goes into greater detail on the wider developments for the entire market, including softening freight rates and capacity flooding back as services return to the Red Sea.”
Data highlights
Market average spot rates – 13 November 2026:
-
Far East to US West Coast: USD 8,360 per FEU (40ft container)
-
Far East to US East Coast: USD 11,249 per FEU
-
Far East to North Europe: USD 3,588 per FEU
-
Far East to Mediterranean: USD 4,666 per FEU
-
North Europe to US East Coast: USD 2,955 per FEU
Change from a week ago (since 6 November 2026):
-
Far East to US West Coast: -0.0% (USD -2 per FEU)
-
Far East to US East Coast: -0.6% (USD -73 per FEU)
-
Far East to North Europe: +0.3% (USD +10 per FEU)
-
Far East to Mediterranean: -0.9% (USD -42 per FEU)
-
North Europe to US East Coast: +1.5% (USD +44 per FEU)
Change since 28 February 2026 (pre-Hormuz crisis):
-
Far East to US West Coast: +344.9%
-
Far East to US East Coast: +324.5%
-
Far East to North Europe: +61.7%
-
Far East to Mediterranean: +40.2%
-
North Europe to US East Coast: +100.1%
Offered capacity – November to date (1–13 Nov) vs October 2026 (average TEU, 4-week rolling average):
-
Far East to US West Coast: 349,556 TEU (+1.7% vs October avg. 343,643 TEU)
-
Far East to US East Coast: 161,571 TEU (-9.9% vs October avg. 179,343 TEU)
-
Far East to North Europe: 302,219 TEU (-7.3% vs October avg. 326,170 TEU)
-
Far East to Mediterranean: 171,312 TEU (-2.4% vs October avg. 175,547 TEU)
-
North Europe to US East Coast: 45,302 TEU (-7.5% vs October avg. 48,981 TEU)
Ends