-1.jpg)

The March 2019 Xeneta Shipping Index public update and commentary on the long-term market is now available. Here is a snippet of how that market has moved so far in March on the main trade corridors.
Excerpt below. Get the full March 2019 XSI® report (PDF) with all graphs here.
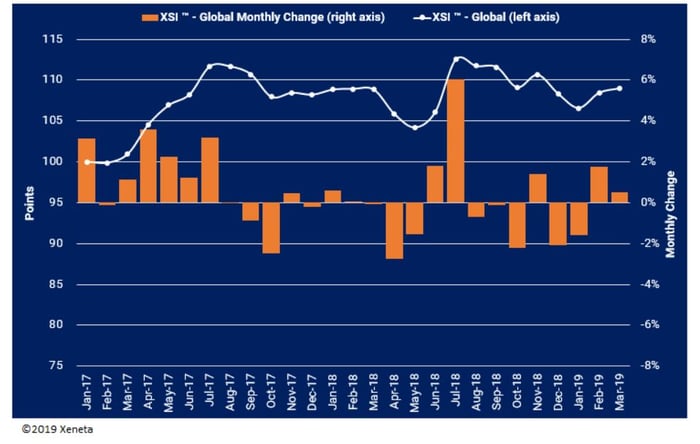
The global XSI® managed to maintain some upward momentum in Mar-19, increasing by 0.5% to 108.99 points.
As a result, the index is now almost unchanged (+0.1%) compared to the same period a year earlier. Meanwhile, since the end of 2018, the benchmark has increased by just 0.6%, with the gains witnessed in the past two months only just offsetting the month-on-month decline reported in Jan-19.
XSI® - Europe Imports / Exports
European imports on the XSI® continued to increase month-on-month but only marginally, jumping 0.1% to 112.34 points. With the index at an all-time high, it is 6.7% higher than the equivalent period of 2018. Since the end of 2018, the benchmark has risen 2.6%, despite spot rates on the key Far East-North Europe trade being in decline.
Meanwhile, exports on the XSI® increased by 1.4% to 109.69 points. Although the benchmark is 1.1% higher than Mar-18, since the end of 2018 it has fallen 0.5%.
XSI® - Far East Imports / Exports
Far East imports on the XSI® increased by 2.0% in Mar-19 to 115.31 points, having declined by a similar amount in the previous month. While the month-on-month change was positive, the index is still 10.7% lower than the equivalent period of 2018.
Exports on the Far East XSI® fell month-on-month by 0.5% to 115.01 points, representing the fourth straight month of declines.
XSI® - US Imports / Exports
The XSI® for US imports fell 0.5% in Mar-19 to 100.40 points and is down 0.4% compared to the same period a year earlier. Since the end of 2018, the benchmark has lost 1.2% of its value, coinciding with a fall in the spot market on the main Far East-US trades.
US exports on the XSI® have continued to recover, increasing by 1.6% month-on-month to 95.06 points. The benchmark is now at its highest point since Jul-17 when it was recorded at 95.35 points.
Don't miss out! Get your copy of the full March 2019 XSI report (PDF) with all graphs now. Xeneta Shipping Index Public .