
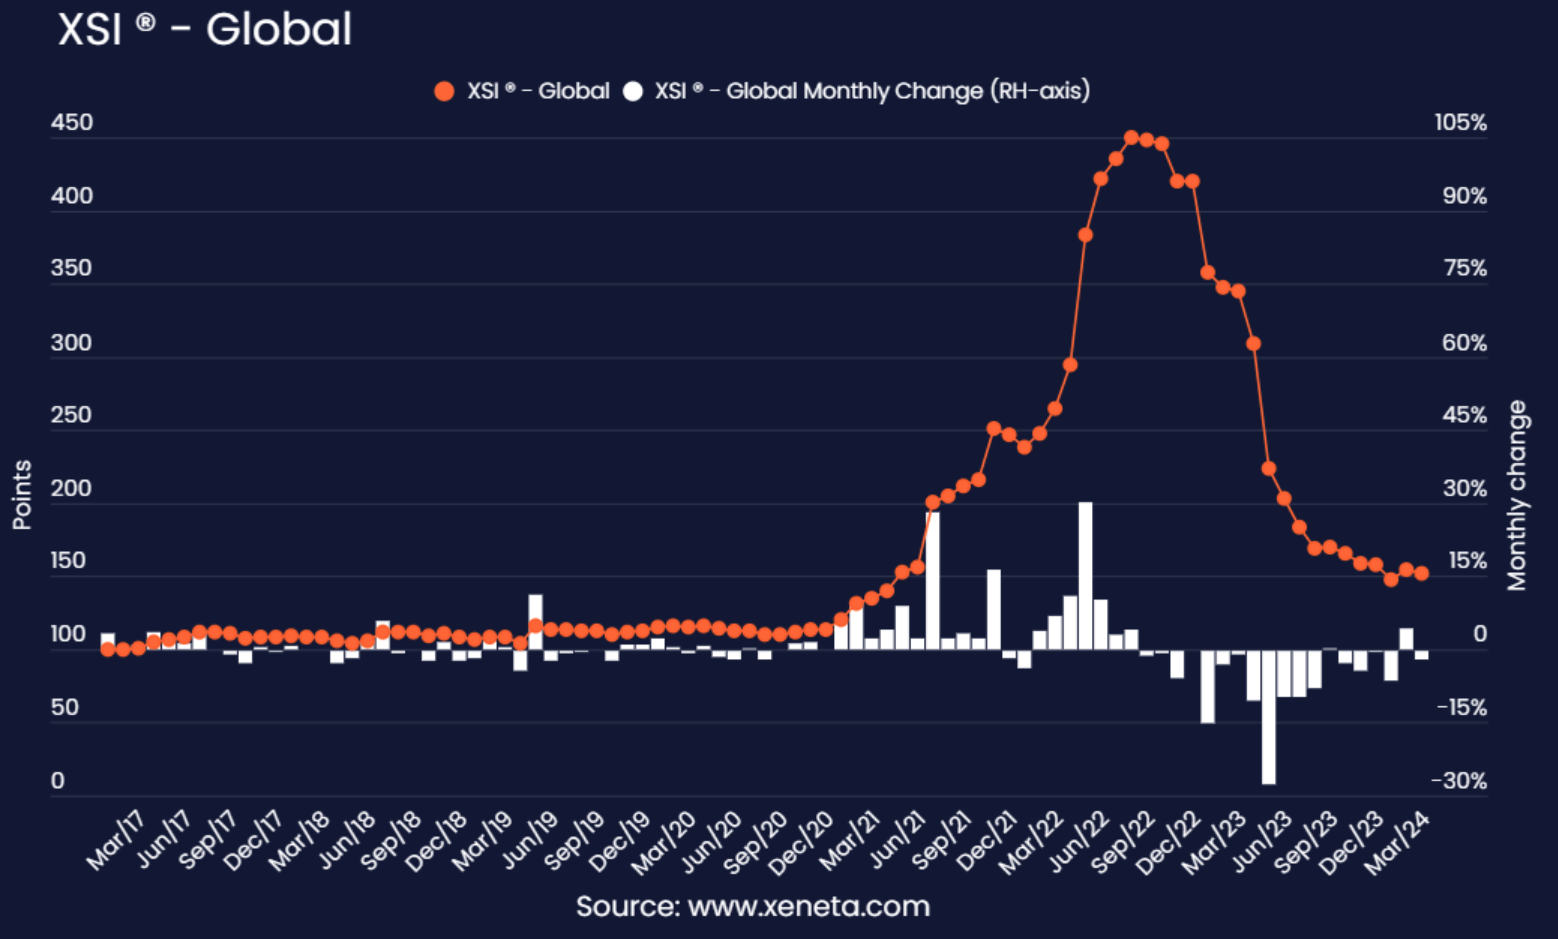
Xeneta’s Global XSI® stood at 151.6 points in March, dropping by 1.8% from its February level. This leaves the global index 56% lower than in March 2023.
The absence of significant movement on the XSI® in March reflects the low number of new contracts entering validity in this period. This is partly explained by it being the final month in the quarter, but also due to shippers choosing to delay signing new long term contracts.
The spot market is still considerably more expensive than the long term market but it is continuing to soften and shippers want to avoid locking themselves into high rates.
Far East
The XSI® for Far East exports fell by 0.8% in March, leaving it at 151.6 points. Despite this most recent slight decrease, the index remains 5.3 points higher than the end of last year due to an earlier increase in February.
These movements, while important, are minimal when placed in the context of the index being 62.4% lower than it was a year ago.
While the XSI® reflects the long term market, it is intrinsically linked to the spot market and it is here that the impact of the Red Sea conflict has been seen most acutely, hitting a peak in January/February before gradually falling back.
US shippers who are also Xeneta customers have been using the platform to demonstrate this softening spot market during long term contracts negotiations and early anecdotal feedback suggests they are receiving larger discounts between tender rounds than they originally anticipated.
Europe
The XSI® for European imports rose by 0.8% in March to stand at 157.4 points. While this is the highest reading so far in 2024 it still leaves the index down by 51.3% compared to March 2023.
The XSI® for European exports fell to 159.0 points in March, down 3.7% from February. This is the lowest this index has been since June 2021 and a year-on-year decrease of 54.8%.
US
US imports saw the biggest month-on-month decline out of all the trades on the XSI®, down by 5.6% from February. This leaves the index at 166.2 points, and 63.7% lower than a year ago, which also makes it the index with the biggest year-on-year decrease.
The XSI® for US exports fell by 0.5% in March, bringing it down to 124.9 points which is the lowest it has been since April 2022.
Xeneta customers receive the full XSI® report detailing movements on the world's lang term markets. This will be vital insight in the months ahead as the industry continues to recalibrate following recent Black Swan events and issues such as overcapacity of supply continue to impact the market.