The February 2019 Xeneta Shipping Index public update and commentary on the long-term market is now available. Here is a snippet of how that market has moved so far in February on the main trade corridors.
Excerpt below. Get the full Feb 2019 XSI report (PDF) with all graphs here.
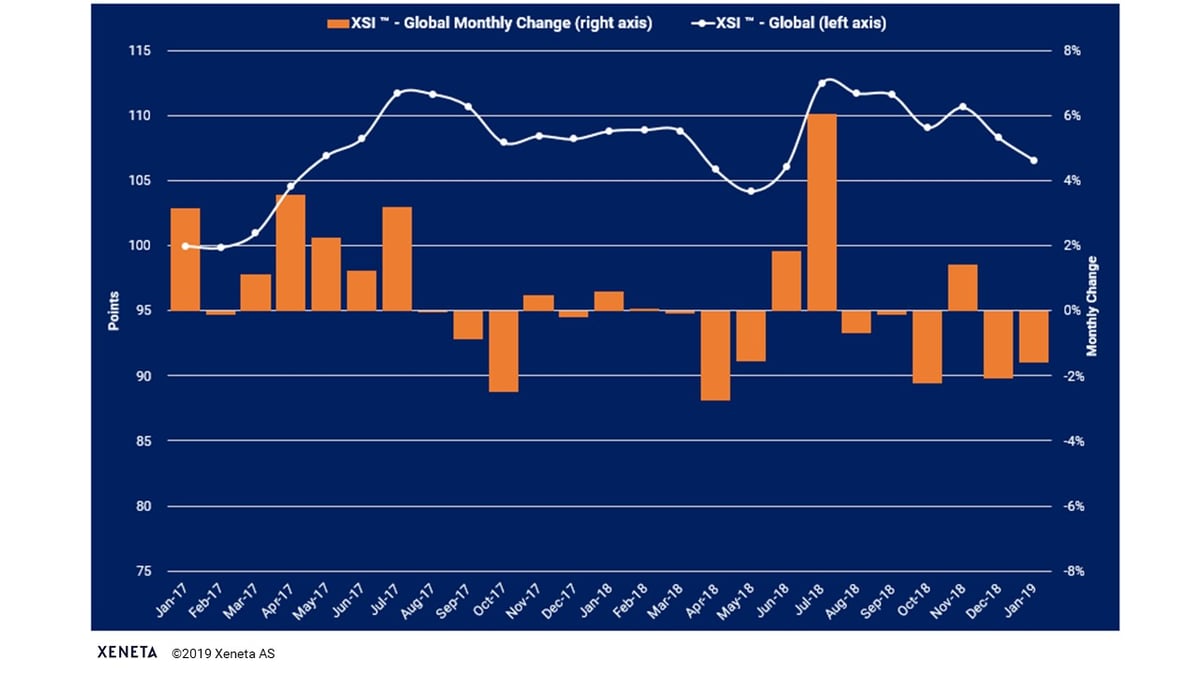
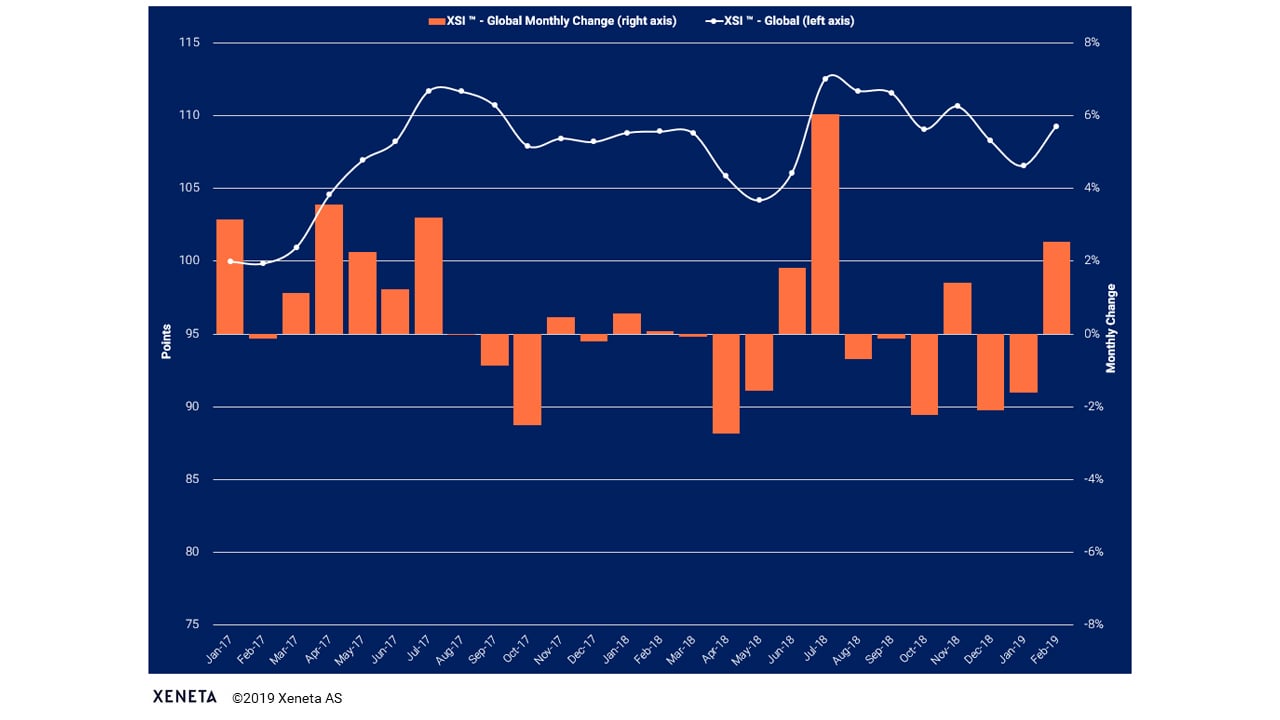
The global XSI® increased by 2.5% in Feb-19 to 109.29, thereby reversing the month-on-month fall reported in Jan-19. Year-on-year the global benchmark is up just 0.3% but the index did increase by a greater percentage compared to the jump 0.1% recorded in the same month of 2018.
Elsewhere, financial results have been in the spotlight during the past month, with carriers reporting mixed results. Lines within the ONE alliance all posted negative results, with MOL recording a year-to-date loss of JPY 14.2bn.
XSI ™ - Europe Imports / Exports
European imports on the XSI® increased 3.9% month-on-month to 112.23 points. This dramatic jump has taken the benchmark to a new all-time high. The last time we noted a bigger increase was back in Jul-18 when it rose 9.9% in a single month.
Exports on the European XSI® rose 0.5% in Feb-18 to 108.22. Despite the increase the index remains 0.4% lower than the same period of 2018.
XSI ™ - Far East Imports / Exports
The year of the pig has started with a whimper rather than a bang with Far East imports on the XSI® falling 2.6% in Feb-19 to 113.01 points. The decline more than offset the increase reported in the previous month, placing the benchmark back on its downward trajectory.
Exports on the Far East XSI® declined 0.2% month-on-month to 115.62 but remain 0.9% higher than same period a year earlier.
XSI ™ - US Imports / Exports
Month-on-month US imports on the XSI® increased 1.0% in Feb-19 to 100.86. Compared to the same period of 2018, the benchmark is almost unchanged, down just 0.1%.
However, developments in US exports were much more positive. In Feb-19 the index jumped by a massive 8% to 93.57, representing the largest single monthly increase since the inception of the XSI®.
###
Don't miss out! Get your copy of the full Feb 2019 XSI report (PDF) with all graphs now. Xeneta Shipping Index Public .