
What the Air Freight Market Looks Like Right Now — and Where It's Heading
Global air cargo spot rates jumped 41% year on year in May 2026. Xeneta and TIACA break down what is driving the market, where rates are heading, and what procurement teams need to know for the rest of 2026.
Xeneta
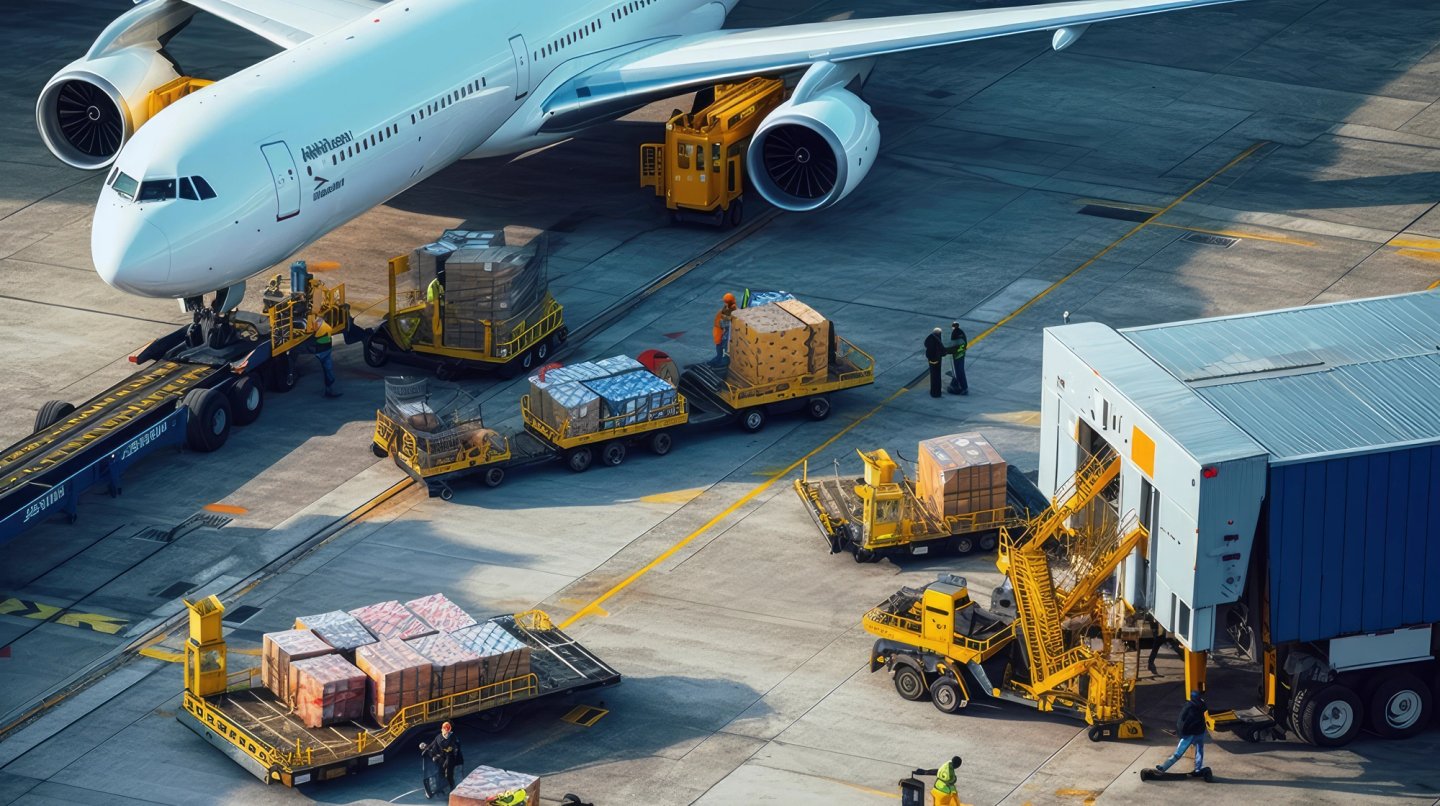
Global air cargo spot rates rose 41% year on year in May 2026, reaching $3.40 per kg — following a three-year high the month before. That figure would have seemed implausible at the start of the year. In a quarterly webinar with TIACA, Xeneta's Chief Air Freight Officer Niall van de Wouw and Lead Air Freight Development and Analyses Wenwen Zhang shared what the data shows, what is driving the numbers, and what procurement teams should expect for the remainder of 2026.
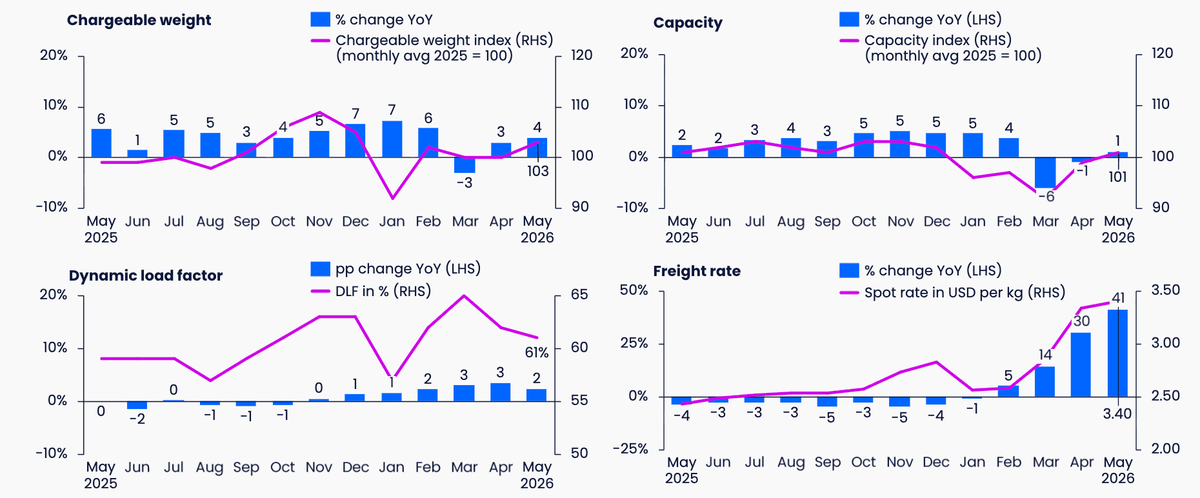
Global air cargo rate jumped +41% year-on-year in May
The Middle East conflict has been the primary shock to the market
The closure of the Strait of Hormuz and the suspension of Suez Canal transits following the escalation in late February reshaped the air freight market within weeks. The affected region accounts for 80% of India to Europe air cargo and 25 to 30% of China and Southeast Asia air cargo to Europe. At the peak of the disruption, jet fuel costs in the region increased by 110%, driven by the market's reliance on Middle Eastern oil for jet kerosene production.
Capacity in the Gulf has since recovered to approximately 70% of pre-war levels as of late May, with freighter recovery at 71% and wide-body passenger capacity at 66%. Major hubs Doha and Dubai have both recovered to 70% of pre-war capacity, while Abu Dhabi has actually exceeded pre-war levels at 106%. Foreign carriers have been slower to restore services than Middle Eastern airlines. As TIACA Director General Glyn Hughes noted on the webinar, the speed of the recovery reflects the resilience of the air cargo industry, even in the face of a shock that effectively closed an entire region overnight.
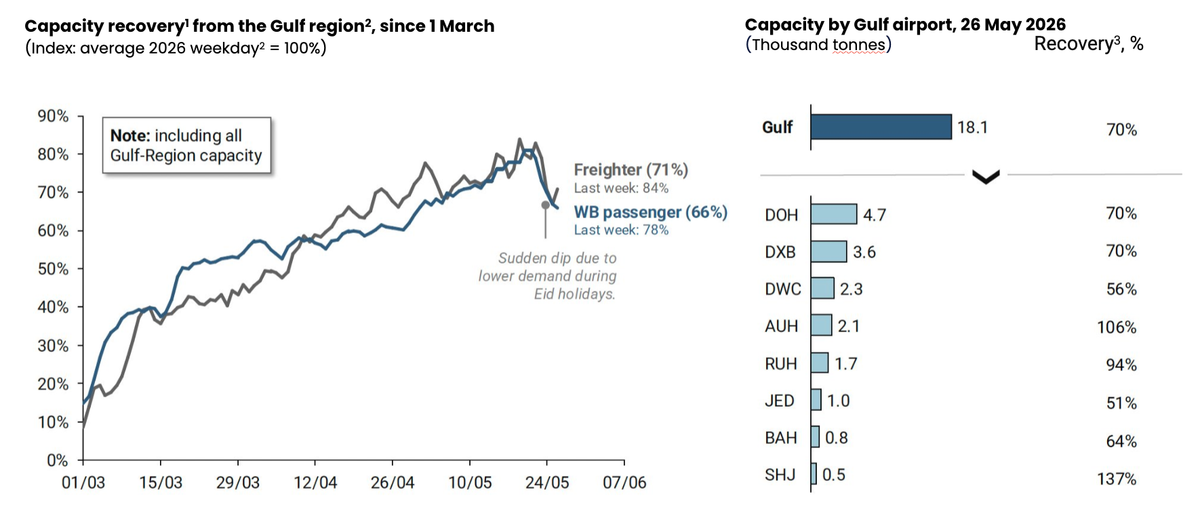
Gulf recovery is stagnant due to Eid. Source: Xeneta/Rotate
By early June, rates were already easing from their May peak. Niall van de Wouw cautioned against interpreting this as a resolution, however. With ongoing fragility in the ceasefire discussions and ships still constrained by maritime blockades, a rapid and complete normalisation remains uncertain.
The corridor-level data for the week of 1 to 7 June illustrates how unevenly the disruption has landed across the market. South Asia to Europe rates are up 74% compared to the pre-war period. Middle East to Europe is up 89%. Northeast Asia to North America is up 37%. The notable exception is Europe to North America, which is down 28% — a figure that reflects the dynamics Niall highlighted on the webinar: summer airline schedules add significant passenger belly capacity on the transatlantic corridor, pushing load factors down and rates with them despite elevated jet fuel costs. It is a clear illustration of why fuel mechanisms are a poor proxy for rate movements in a market driven primarily by supply and demand.
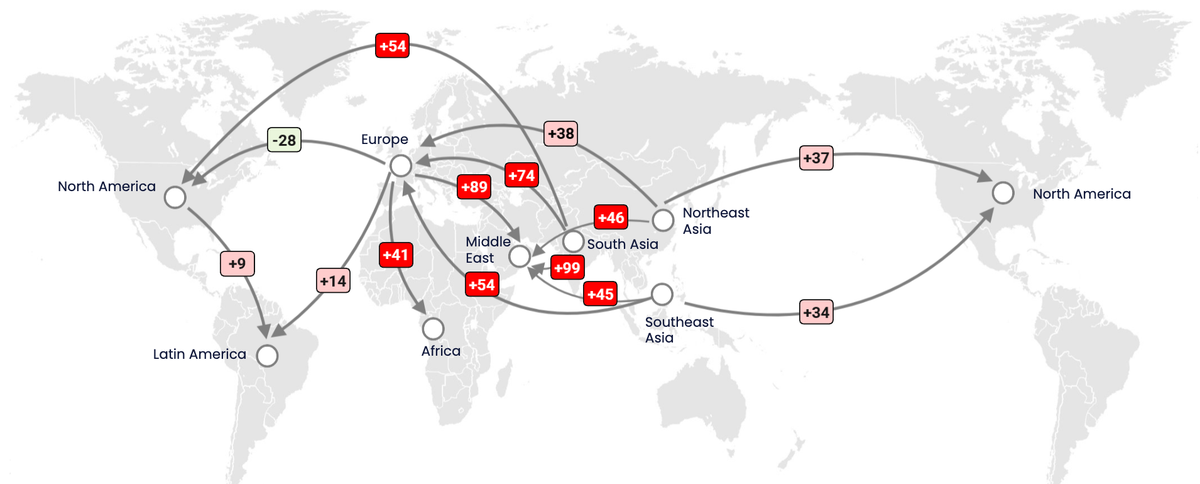
Air cargo spot rate developments on selected corridors, Week 23 (1 to 7 June 2026)
(Percentage change vs week 9 from 23 February to 1 March, 2026)
Capacity utilisation on key corridors is at levels rarely seen
Asia Pacific to North America is operating at a dynamic load factor of 90%, and Asia Pacific to Europe and Middle East both sit at 87%. As Niall explained, 90% represents a near-practical maximum for air cargo given that not every flight on those routes is optimised for cargo. The market is effectively full on those corridors, and the driver is not only the Middle East disruption.
Semiconductors have replaced e-commerce as the primary engine of air freight demand
The growth engine that defined air freight for much of the past two years has shifted. In its place, semiconductors and the infrastructure demands of hyperscalers have become the dominant driver of premium air freight demand. Global semiconductor revenue grew 106% year on year in early 2026, and the correlation with transpacific air freight rates is direct. In May 2026, air cargo rates from Taiwan to the US were running at $7.02 per kg, up 24% year on year. From China to the US, rates reached $5.86 per kg, up 46%. Malaysia to the US was at $6.69 per kg, up 36%.
The companies moving this cargo are operating in an environment where the competitive stakes of receiving components quickly outweigh the cost of freight. As Niall noted on the webinar, whether they pay five, six or seven dollars a kilo is largely secondary to receiving the infrastructure they need to build data centres and deploy AI applications as fast as possible.
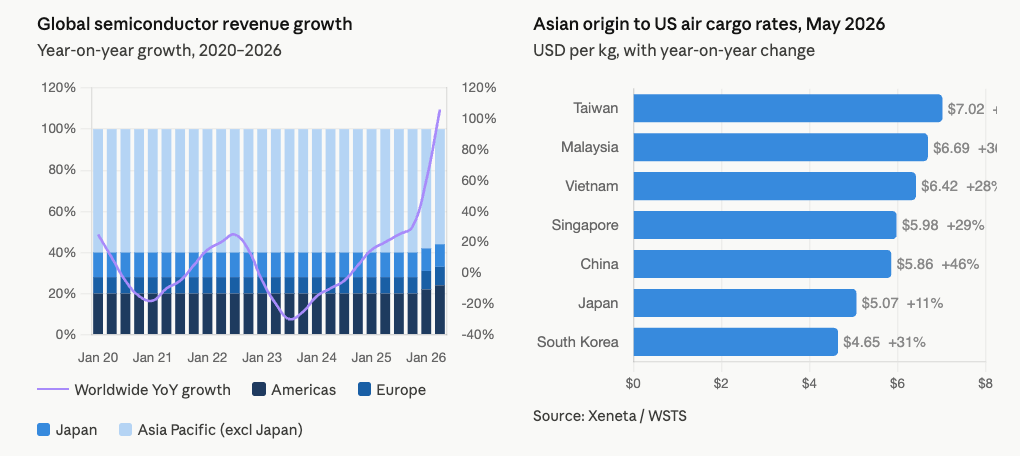
Semiconductor demand lifts transpacific air freight rates. Source: Xeneta/WSTS]
E-commerce volumes, by contrast, have slowed materially. China's B2C cross-border e-commerce exports fell 11% year on year in April 2026 in aggregate, with exports to the US down 33% and exports to Europe down 6%. The US de minimis revision and the EU's new per-line-item fee structure have introduced friction into cross-border flows, though the impact in Europe is expected to be less severe than in the US given the different regulatory intent behind each measure. Niall and Glyn Hughes both noted that while the absolute volumes being moved remain large, the growth that was pushing air freight rates upward a year ago is no longer present.
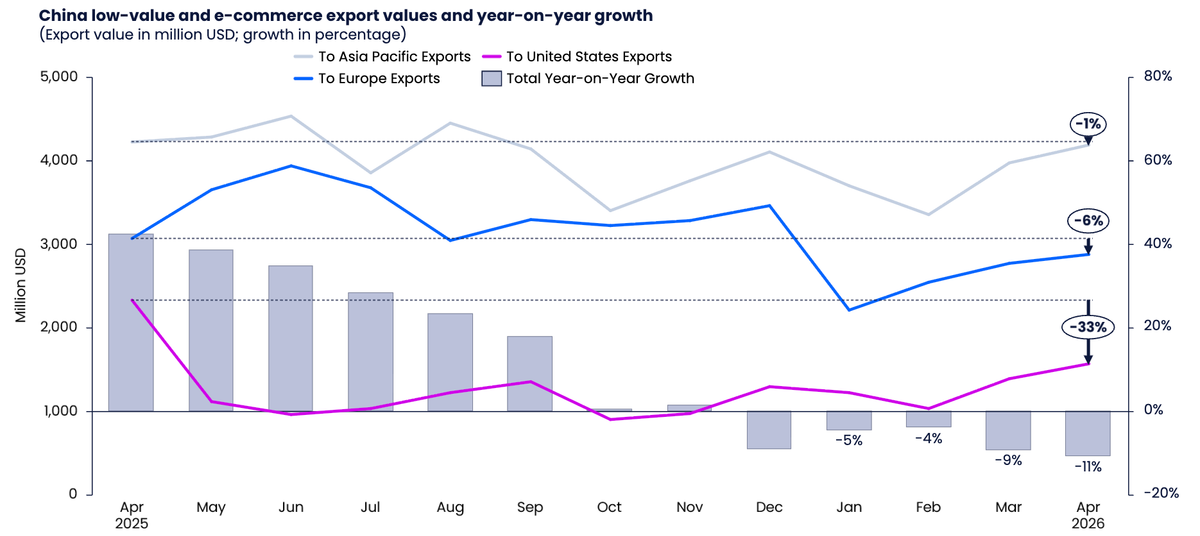
China's B2C cross-border e-commerce exports continued to fall in April. Source: Xeneta/Trade and Transport Group
Contract structures are shortening under the weight of uncertainty
One of the more significant signals from Xeneta's proprietary data is what is happening to contract validity. In Q2 2026, 22% of new contracts are valid for one month only — more than double the 9% share recorded in Q2 2025. The share of air freight rates between forwarders and airlines valid for less than 30 days has reached 51%, levels not seen since the height of the COVID pandemic.
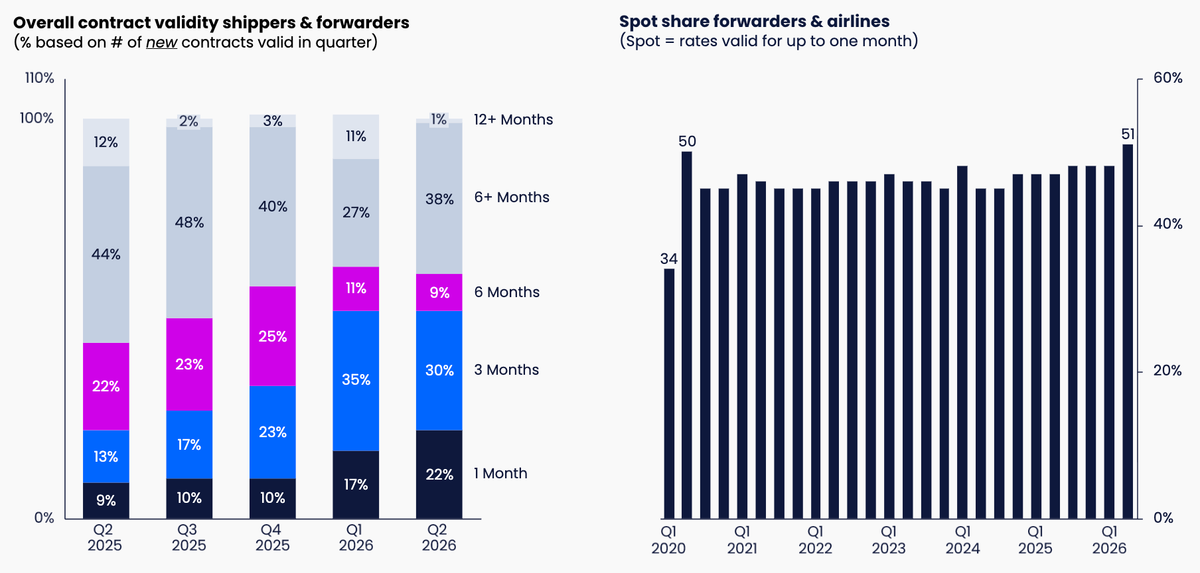
Uncertainty is reviving shorter-term deals. Source: Xeneta
For buyers, this creates a significant administrative burden. As Niall observed, the amount of negotiation taking place in the market at the moment is substantial. One Xeneta customer reported that a six-month rate they had negotiated was voided three weeks into the contract as the market moved beyond what the forwarder was willing to honour. It is a dynamic that puts significant pressure on commercial and procurement teams who are trying to plan with any degree of certainty.
Ocean frontloading: an early peak is building
A secondary effect is building in the ocean market that could have implications for air freight in the coming months. Some shippers are already front-loading goods from Asia Pacific ahead of expected ocean freight rate increases. Far East to US West Coast ocean spot rates have risen 128% from their recent lows, and Far East to North Europe is up 68% over the same period. Shippers are moving goods forward to avoid higher costs down the line, which is generating early pressure on ocean capacity and creating conditions similar to the early peak season seen in 2024. Historically, when ocean schedule reliability decreases, a portion of volume shifts to air — providing a potential boost to air freight in what would otherwise be a relatively quiet summer period.
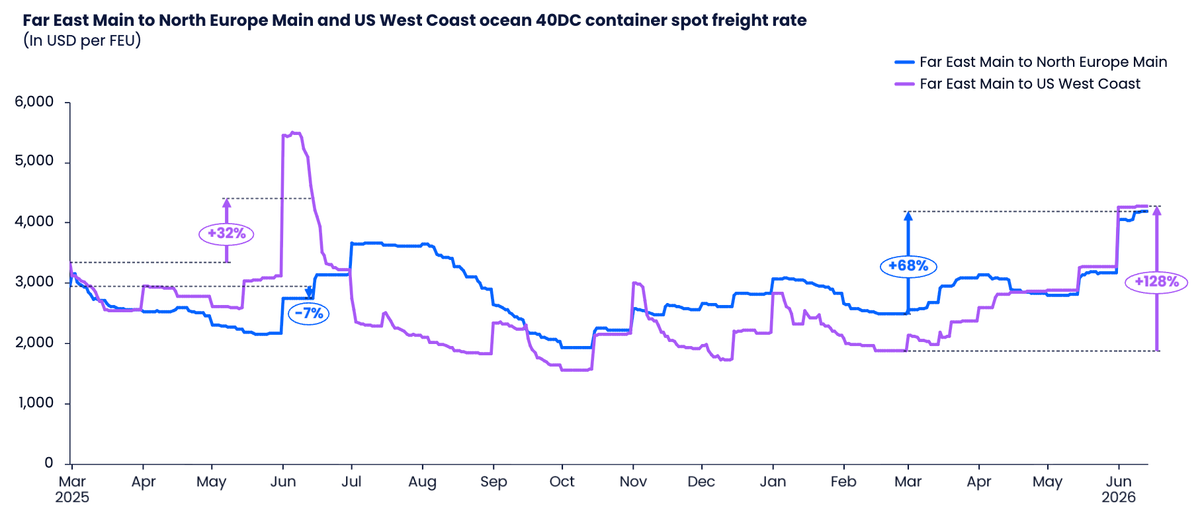
Ocean frontloading may build inventories, dampening air freight demand. Source: Xeneta
The outlook for the rest of 2026: demand and supply moving in sync
For the remainder of 2026, Xeneta expects demand and supply to grow broadly in line with each other, both at approximately 2 to 3%. The expectation of a significant downward correction in rates that had been built into the Q4 2025 outlook has been overtaken by the disruption of the first half of the year, making a full-year decline in rates now unlikely. A traditional Q3/Q4 peak season driven by e-commerce is not expected.
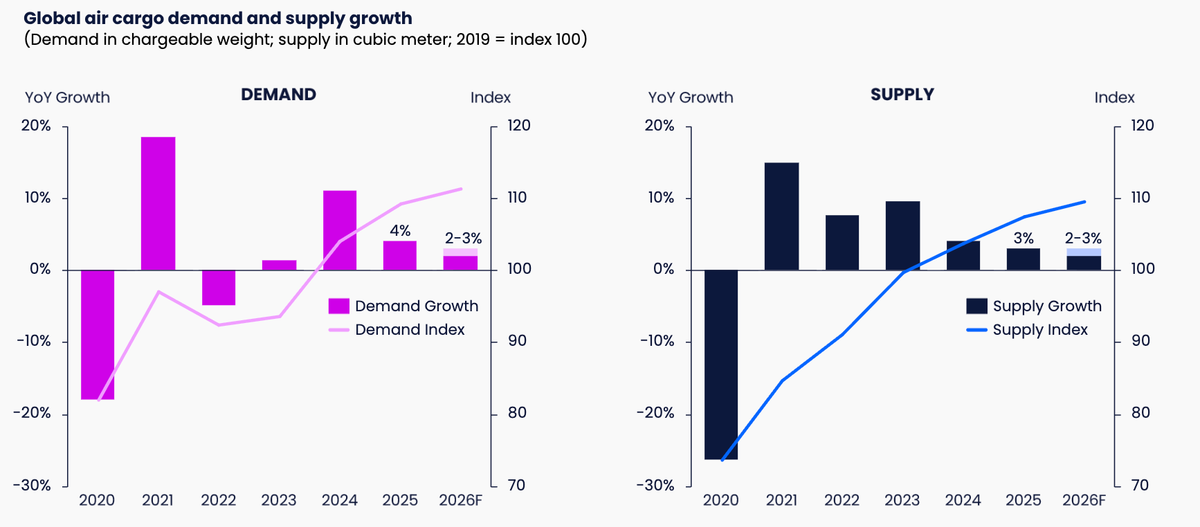
Global air cargo demand may keep pace with capacity growth in 2026. Source: Xeneta
Level the Playing Field in Air Freight
The teams navigating this market most effectively are the ones with a complete, independent view of it — shipper contract rates, airline selling rates, and supply and demand signals in one place. Xeneta Air gives procurement teams the same market intelligence their counterparts on the other side of the negotiation already have. Explore Xeneta Air or watch the webinar on demand to see the full data behind this analysis.
Related posts



No results to show.