
The 2027 Outlooks are live
Air and Ocean. Know the swing factors behind 2027 freight rates.
Trusted by the world's largest
shippers, forwarders, carriers and airlines.












Demand
Global container demand growth
Fleet
Container fleet growth, as 2.9m TEU of new capacity arrives against 0.5m TEU scrapped
Spot rates
Global spot rates across 2027, against the Q3 2026 level
Demand
Global air cargo demand growth, chargeable weight
Capacity
Global capacity growth, upper half if Gulf capacity returns early
Airline rates
Global airline average rates, from 2026’s elevated base
Two modes. One question: what could swing 2027?
Fundamentals point to softer rates. The Outlooks show what could override them, and what it means for your lanes.
Upcoming webinar
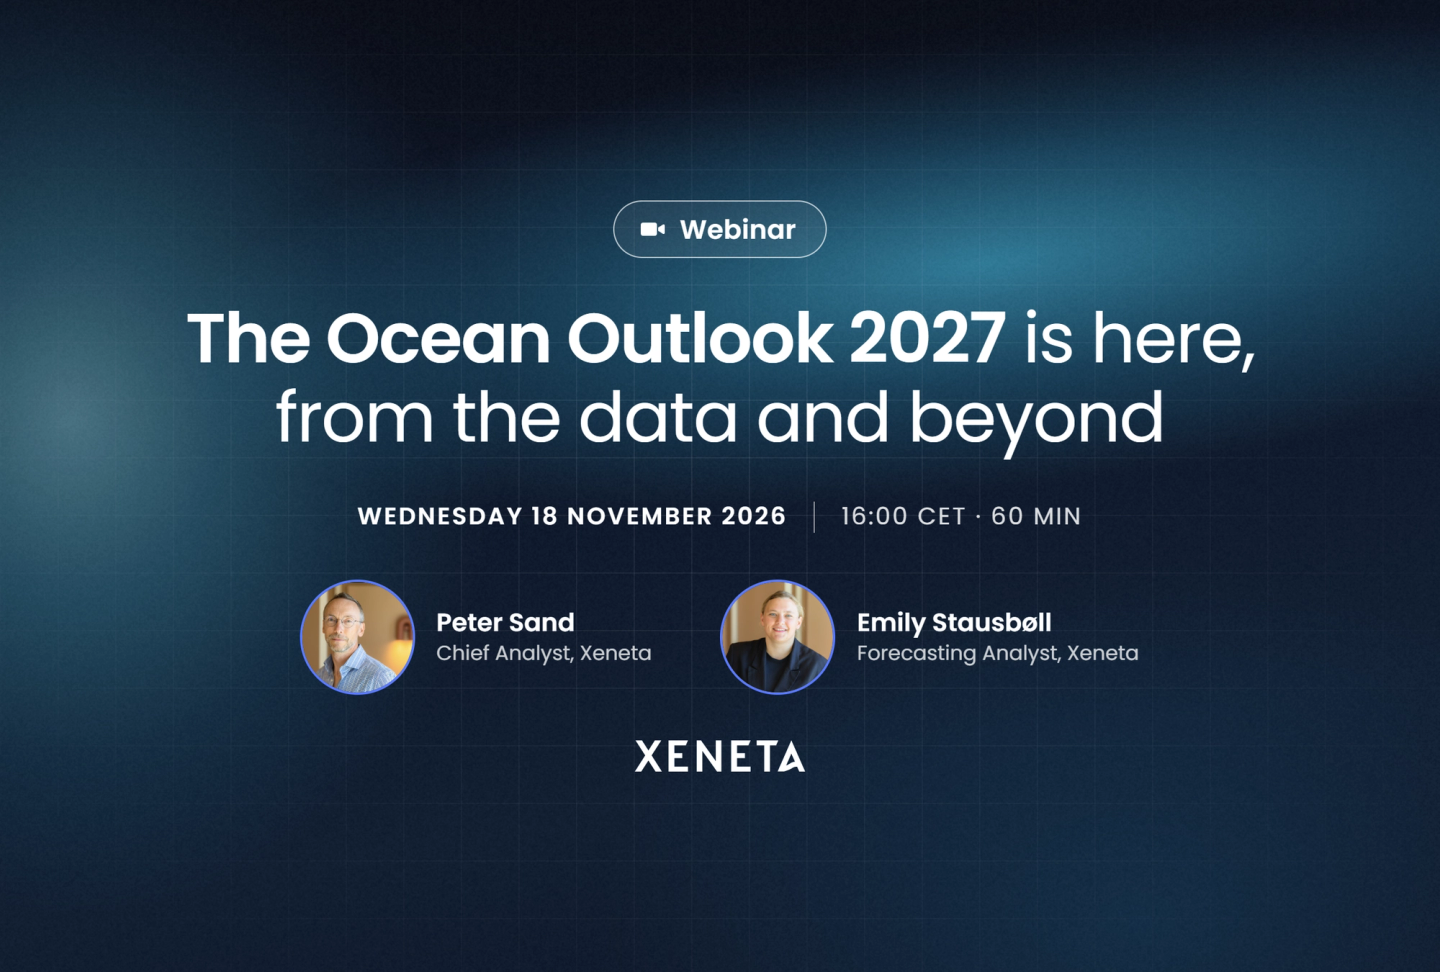
The Ocean Outlook 2027 is here, from the data and beyond
For the third year running, a market that was supposed to soften did the opposite. Peter Sand and Emily Stausbøll present the full-year 2027 forecast for spot and long-term rates, live.
Wednesday
CET
A 30% fall in the global average isn’t a 30% fall on your lanes
Your forecast depends on which corridors you ship, whether you sit on a fronthaul or a backhaul, your Gulf routing exposure, and how your contracts handle fuel surcharges. Xeneta pairs independent market data with the people who know how to use it.
700M+
Data points
From the world’s largest shipping companies, processed for real-time market intelligence
250+
Years of freight experience
Combined across the Advisory team
550+
Advisory engagements delivered
60+
Enterprise shippers supported in tenders
From 5,000 to 500,000+ TEU a year
See how Xeneta helps
Stanley Black & Decker
How Stanley Black & Decker save millions with Xeneta Market Insight.
How Stanley Black & Decker save millions with Xeneta Market Insight
FEUs shipped annually
Savings in total freight spend

Data tells you where the market is. Advisory helps you decide what to do about it
The harder part is standing in front of a CFO, or across the table from a carrier in round three, and knowing what it means for your decision. That’s what the Xeneta Advisory team is here to talk about.
Round-by-round tender support, from first bids to final nomination
Quarterly market reviews your leadership team can act on
Forecasts built around your own trade lanes, not the global average