
Freight volatility demands better visibility
Independent benchmarks built on real contracts, so you can negotiate fairly, plan with confidence and protect your supply chain.
Trusted by the world's largest
shippers, forwarders, carriers and airlines.












Freight decisions are still made without seeing the market
Volatile rates, limited transparency and manual processes leave teams negotiating with half the picture.
Rates drift between tenders
Contracted rates fall out of line with the market, and nobody notices until the invoice.
Data comes from one side
Carrier guidance and quotes show what sellers want, not what the market pays.
No shared view
Procurement, logistics and finance each work from different numbers.
What changes when you can see the market
What makes Xeneta unique
Data visual
This page could not be loaded. Please try again later.
Trusted real market data
The largest and most complete freight dataset in the industry. Sourced from actual shipper contracts, forwarder agreements, AIS vessel data and airway bills, giving you a true view of the real market.
Explore our dataPlatform visual
This page could not be loaded. Please try again later.
Powerful tools and insights
A modern intelligence platform that transforms millions of raw, unstandardized data points into clean, comparable and actionable insight, from rates to service levels, helping you make confident, data-driven decisions.
See our platformExpertise visual
This page could not be loaded. Please try again later.
Human expertise and community
Freight analysts, data specialists and industry experts guide you through market shifts and freight strategies, supported by a global community of the world’s largest shippers sharing insight, best practices and real-world experience.
Discover our expertiseBenchmarks built on real contracted rates
Rates come from the contracts shippers and forwarders actually sign, never from carriers, so the market view stays neutral.
- Contracted rate data points
- 900M+
- Ocean port pairs
- 170k+
- Airport pairs
- 20k+
It's not just rates. It's the full picture of freight
Seven datasets covering every signal that shapes the cost and risk of moving freight, sourced from real shipper and forwarder contracts and refreshed daily.
Without the platform, we'd be blind going into the market. Xeneta helps us negotiate better and track savings of 3–5% on a multi-million-dollar spend.
David Lenaers
Global Director of Logistics Sourcing · Stanley Black & Decker
Organizations rely on Xeneta data
Customer renewal in 2025
How shippers put Xeneta to work

30% lower rate on a single lane
ABF benchmarks 100,000+ TEU a year with Xeneta, worth close to $1.5M on one lane.
Read the case study
~40% lower spend on key lanes
BAT simplified a complex supply chain, consolidated tenders and cut spend on key lanes.
Read the case studyWhat you can do in the platform
Each use case has its own page, with the workflow, data and customer results behind it.
Meet the experts
Our analysts are quoted by the WSJ, FT and Reuters, and they're on hand to put the numbers in context for your team.
Learn why leading shippers, forwarders and carriers choose Xeneta
Why Xeneta
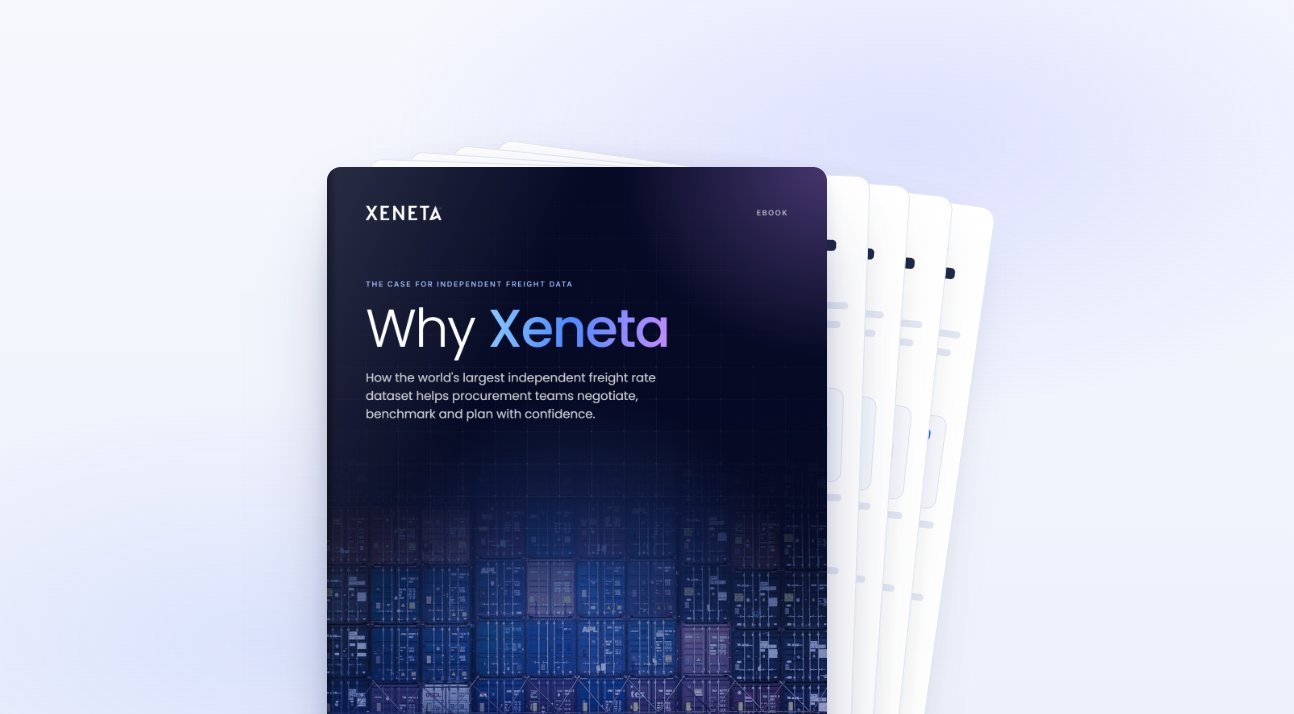
A better way to navigate freight volatility. Discover how top-performing teams are gaining an edge with deeper, more complete market data.
Frequently asked questions
Why do I need Xeneta if I already run competitive and data-backed freight tenders?
Competitive tenders create pressure, but they do not guarantee market-aligned outcomes. Carriers know your tender process, your volume, and your historical rates, and they price their bids accordingly. When every carrier in your tender is working from the same market knowledge and you are not, the lowest bid you receive is the most competitive rate carriers were willing to offer, not necessarily the rate the market supports.
Many procurement teams fill this gap with publicly available indices or rate guidance from their own carriers and forwarders. The problem is that indices track broad market averages across major lanes, which may bear little resemblance to what is actually achievable on your specific corridors, equipment types, and contract terms.
Xeneta removes that information asymmetry. When carriers know a shipper has independent, third-party market evidence in the room, bids come in lower. Beyond the tender itself, Xeneta provides continuous visibility into whether rates awarded remain competitive as the market moves through the contract period.
What makes Xeneta's data different from other freight market data sources?
Most freight market data reflects one side of the transaction. Spot indices track publicly visible rate movements on major trade lanes but do not capture what shippers with volume and negotiating leverage are actually paying under contract. Broad corridor averages aggregate across lane combinations that may bear little resemblance to your specific origins, destinations, equipment types, and contract terms.
Xeneta's data is sourced differently. The platform aggregates real contracted rates contributed by thousands of shippers and forwarders globally. The granularity is what matters: a benchmark is only useful in a negotiation if it reflects the specific lane, equipment type, and market segment you are buying in.
All contributed data is fully anonymized and aggregated, and Xeneta operates as an independent platform with no stake in the rates you ultimately agree.
What ROI can I expect from Xeneta, and how quickly does it materialize?
ROI from Xeneta typically materializes within the first tender cycle after adoption. The specific value depends on freight spend and how far current contracted rates have drifted from market, but customers consistently report savings on lanes where Xeneta reveals above-market contracts, often on lanes where procurement previously believed rates were already competitive because they had survived a tender process.
For companies spending $10M or more annually on ocean freight, even a modest improvement in contracted rates generates savings that represent a multiple of the platform cost. Stanley Black and Decker, with over $100M in annual logistics spend, consistently track savings in the range of 3 to 5 percent using Xeneta.
Rate savings are the most immediately quantifiable return, but they are not the only one. Carrier reliability data helps teams select suppliers whose operational track record supports the service levels supply chains depend on, and transit time improvements on high-volume lanes reduce in-transit inventory.
How does Xeneta help me demonstrate procurement performance to finance and supply chain leadership?
One of the most consistent frustrations in freight procurement is the difficulty of demonstrating value to leadership who lack the context to assess whether contracted rates are competitive. Saying rates went down in a tender is not the same as proving they went down relative to the market.
Xeneta provides the independent, third-party evidence to make that case with data. Specific, quantified comparisons between contracted rates and what the broader market paid. Round-by-round tender analysis showing how each outcome compared to market benchmarks. Year-on-year performance tracking that demonstrates improvement over time.
The platform also allows teams to benchmark their rates against shippers in the same industry and against companies moving similar freight volumes, providing the peer context that turns a good internal performance story into a genuinely compelling one.