
Track and compare ocean schedules across carriers and lanes
Use service performance data to plan shipments, validate schedules and avoid surprises caused by unreliable ocean services.
Trusted by the world's largest
shippers, forwarders, carriers and airlines.












Ocean schedules rarely perform as planned
Operations plan on fragmented schedule data, without seeing how services actually perform.
Awarded on rate alone
Services are awarded on price, not on how reliably they execute.
Surprises found too late
Delays, blank sailings and missed port calls surface after booking.
No single source of truth
Every team works from a different view of service reliability.
Every service on your lane, planned vs actual
Search a port pair to see each carrier's services, reliability and blank sailings side by side.
Close the gap between plan and performance
A carrier-neutral view of how ocean services actually perform. We measure proforma against actual, not carrier forecasts.
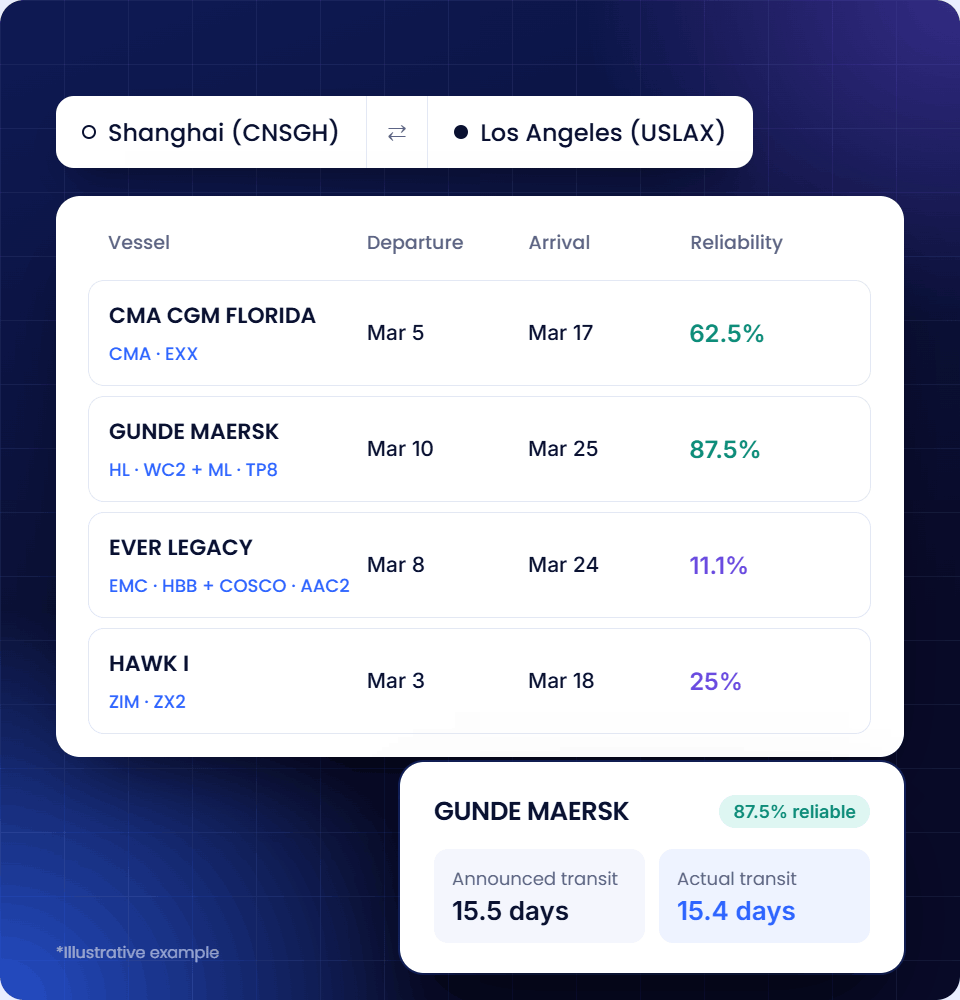
Check reliability before you book
See how each service has really performed against its structural schedule before you commit to transit times.
Announced vs actual transit times
Reliability rate by service
Search by carrier, service or port pair
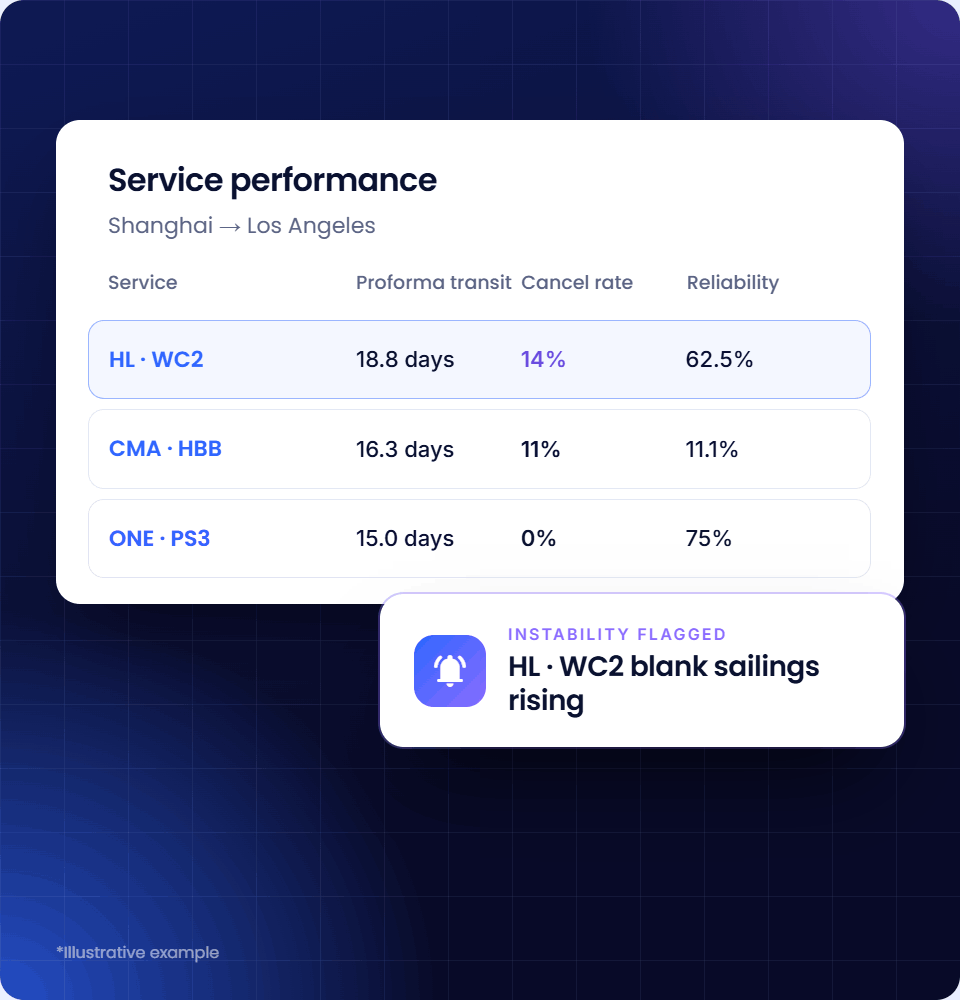
Catch blank sailings and delays early
Track cancellation patterns, port call performance and recurring instability, so delays are explained before they hit.
Blank sailing and cancellation patterns
Port call performance and delays
Recurring service instability flagged
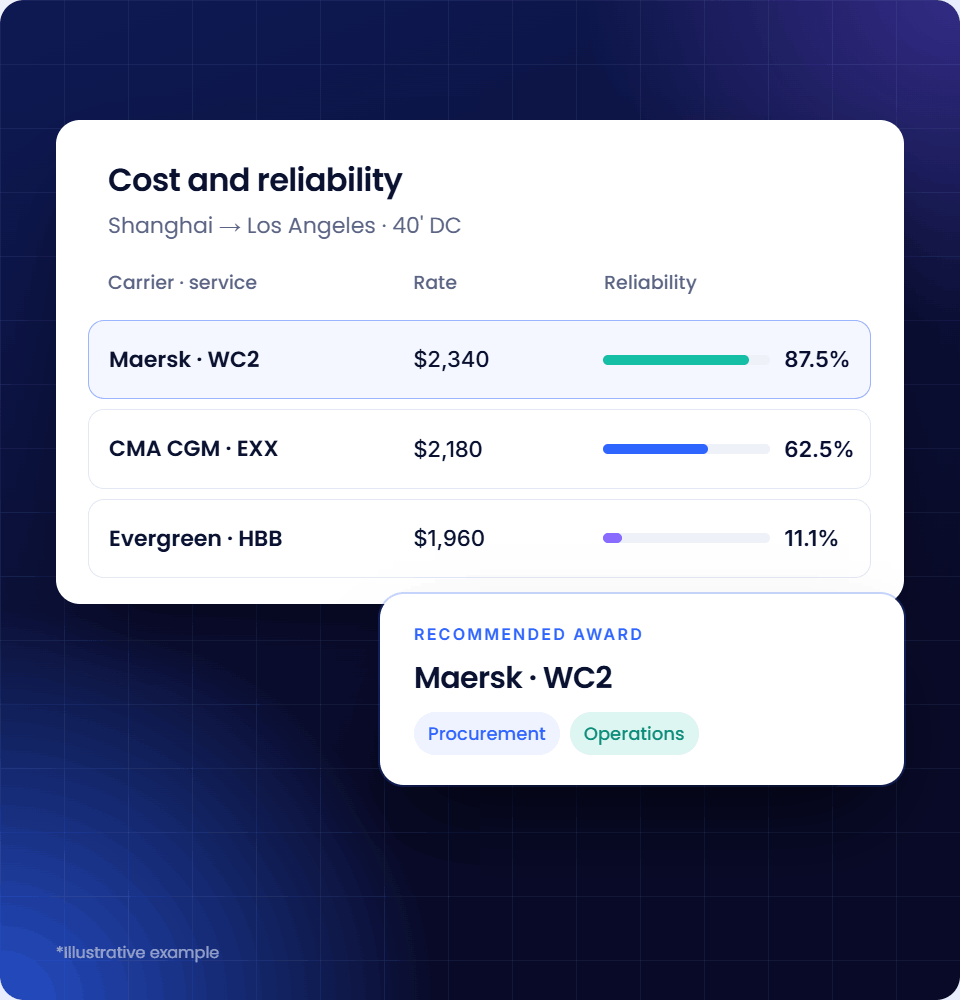
Award contracts operations can execute
Put reliability next to rates in the same workflow, so procurement picks services operations can deliver on.
Cost and reliability in one view
Carrier comparison by port pair
Shared truth for procurement and ops
Measured against the schedule, not carrier forecasts
Carrier structural schedules from eeSea, tracked against actual vessel movements via AIS, give an unbiased view of reliability.
- Corridors covered
- 400+
- Ports tracked for congestion
- 654
- Vessel arrivals a month
- 50k+
From raw vessel signals to reliable benchmarks
Carrier schedules from eeSea are matched against real vessel movements, then cleaned and checked daily.
Collect
Carrier proforma schedules, terrestrial and satellite AIS signals, and port schedule feeds.
Cleanse
Invalid and duplicate AIS signals are removed, and port calls reconciled with the proforma.
Consolidate
Every sailing is mapped to its port pair and the ETA the carrier originally committed to.
Validate
Arrivals and cancellations are cross-checked every day.
See how shippers plan on real performance

Rate vs service, rebalanced to 70/30
Hitachi Energy weighs rate against service with Xeneta data across 15,000 TEU a year.
Read the case study
Supply chain performance, tracked
Shipping 100,000 TEU a year, Continental validates bids and tracks supply chain performance.
Read the case study
2,300 lanes benchmarked with confidence
Moving 185,000+ TEU, Electrolux keeps container costs to 10% of total logistics spend.
Read the case study
240,000+ TEU benchmarked a year
Visy Logistics negotiates from a position of strength with Xeneta data across its network.
Read the case studyHow shippers regain leverage in carrier-led markets
Our analysts answer the 48 questions shippers raised at our recent roundtables, so you can go into your next tender with a plan.
Get the report
Go deeper on schedule reliability

Stop betting on carrier promises
A Red Sea special on tracking real carrier behaviour and reliability in volatile markets.
Watch now
Container rates, carrier reliability and what’s next
Real dry container lanes benchmarked against independent data, with carriers compared on price and reliability.
Watch now
Rebuilding trust in carrier performance data
Why carrier performance data breaks down, and how to rebuild a version you can trust.
Watch nowOcean schedules, answered
What data sources does Xeneta use?
Xeneta Ocean Schedules is powered by data from our 2024 acquisition of eeSea and its carrier-provided schedules, combined with AIS (Automatic Identification System) vessel tracking data. This includes structural schedules from carriers, actual vessel movements tracked via AIS, port call data, capacity information, and blank sailing intelligence.
Can I search by specific port pairs or corridors?
Yes. All performance data is fully searchable by carrier, service (e.g., TP10, AE1), port-pair, corridor, and time period. For vessel search, it's available at the port-pair level.
Can I integrate this data into my existing workflows?
Yes. Ocean Schedules is embedded directly in the Xeneta platform and integrated with our rate and tendering datasets, allowing you to combine cost + reliability in one decision workflow.
How do I get started?
If you're already a Xeneta customer, Ocean Schedules is available now in your Explore or Achieve bundle. If you're new to Xeneta, book a demo to see how it works.