
Datasets
Live price, capacity, reliability and emissions data from the largest network of shippers and forwarders.
A unified platform to benchmark rates, compare carriers, run faster tenders and adapt to market shifts.
Trusted by the world's largest
shippers, forwarders, carriers and airlines.












Rates, reliability and capacity sit in separate tools, decks and spreadsheets.
By the time bids are compared lane by lane, the market has already moved.
Red Sea diversions, congestion and blank sailings upend budgets built on old rates.
Independent market truth from real shippers and forwarders, gathered from real contracts every day.
900M+
Refreshed every 24 hours
170K+
Across 165 countries
13+
Rates, reliability, capacity and more
The leading freight intelligence platform, built on rate and performance data from the world's largest network of shippers and forwarders.
Benchmark, tender and plan from one platform, with the same independent data behind every decision.
Benchmark rates visual
This page could not be loaded. Please try again later.
Validate rates and carrier performance against the market on every lane.
Benchmark contract and spot rates by lane using real shipper and forwarder data
Identify outliers and overpriced trades with objective comparisons
AI agents highlight trades that fall outside market norms
Run tenders visual
This page could not be loaded. Please try again later.
Simplify your tender process and keep internal teams aligned with clean, data-backed insights.
Upload and benchmark thousands of lanes instantly
Validate bids or pricing strategies
Avoid inflated awards or underpriced commitments
Plan budgets visual
This page could not be loaded. Please try again later.
Plan freight budgets and manage risk with neutral, forward-looking market data.
Forecast contracted rates up to 3 months ahead and spot rates 10 days out
Build regional and global budgets with cost scenarios across modes
Identify risk hotspots by lane, supplier or region
Every signal that shapes the cost and risk of moving freight, sourced from real shipper and forwarder contracts and refreshed daily.
Live price, capacity, reliability and emissions data from the largest network of shippers and forwarders.
Run tenders, compare carriers, manage rates, forecast shifts, run index-linked contracts and work faster with AI agents.
Guidance from industry veterans, with regular market outlooks, webinars and 1:1 customer success support.
Supporting every link in the ocean freight value chain.

How Nestlé compressed tender cycles and elevated procurement decisions with real-time data.
Read the case study
Shipping 40,000+ FEU a year, Stanley Black & Decker saves millions with Xeneta Market Insight.
Read the case studyOur analysts answer the 48 questions shippers raised at our recent roundtables, so you can go into your next tender with a plan.
Get the report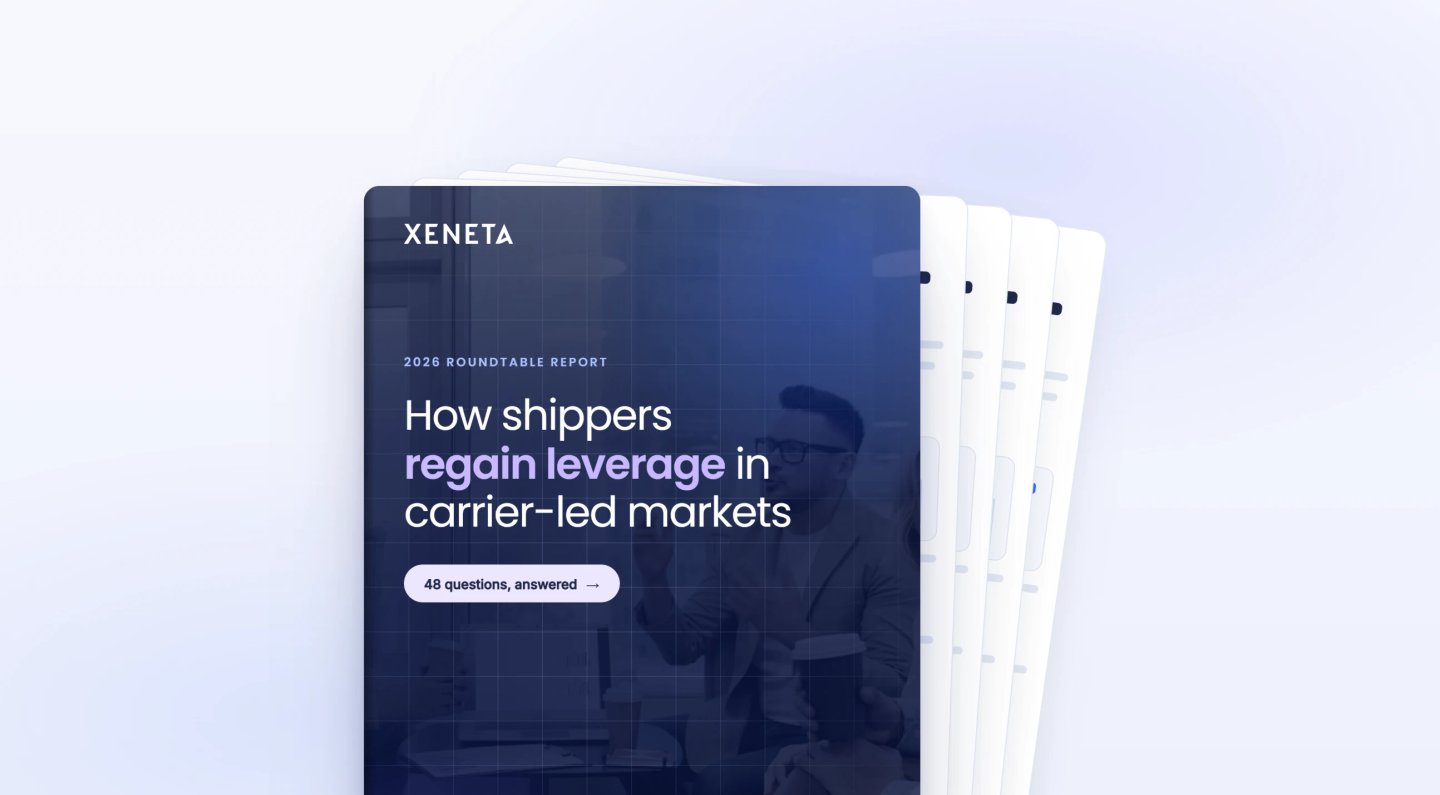
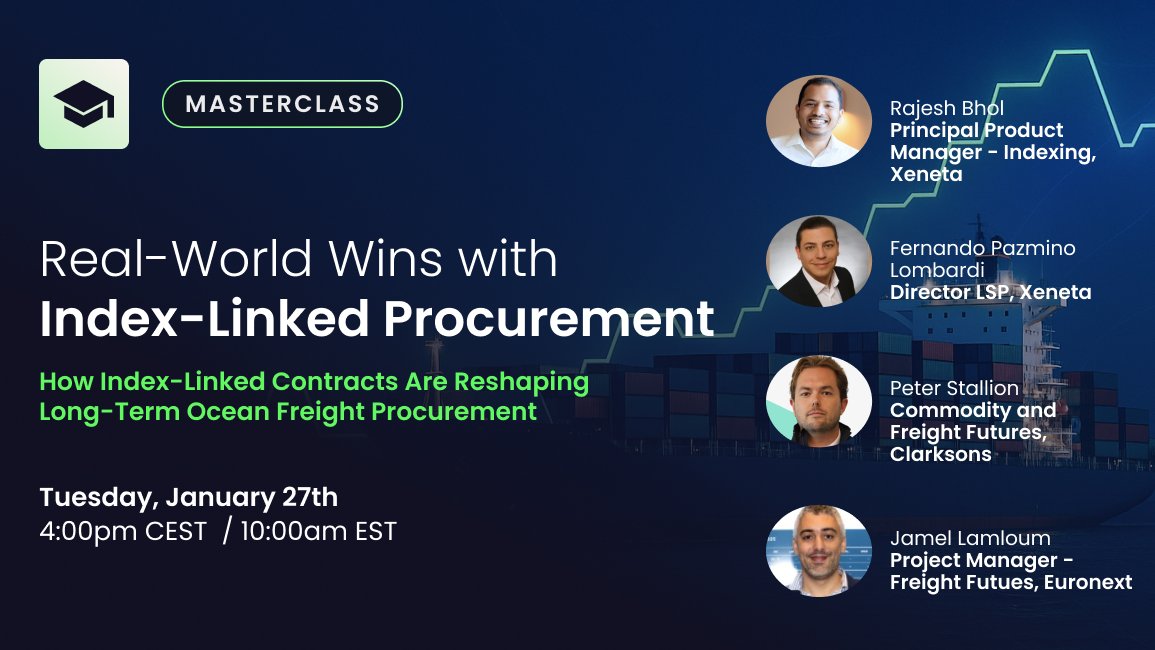
Rethinking ocean freight procurement with index-linked and hedged contracts.
Watch now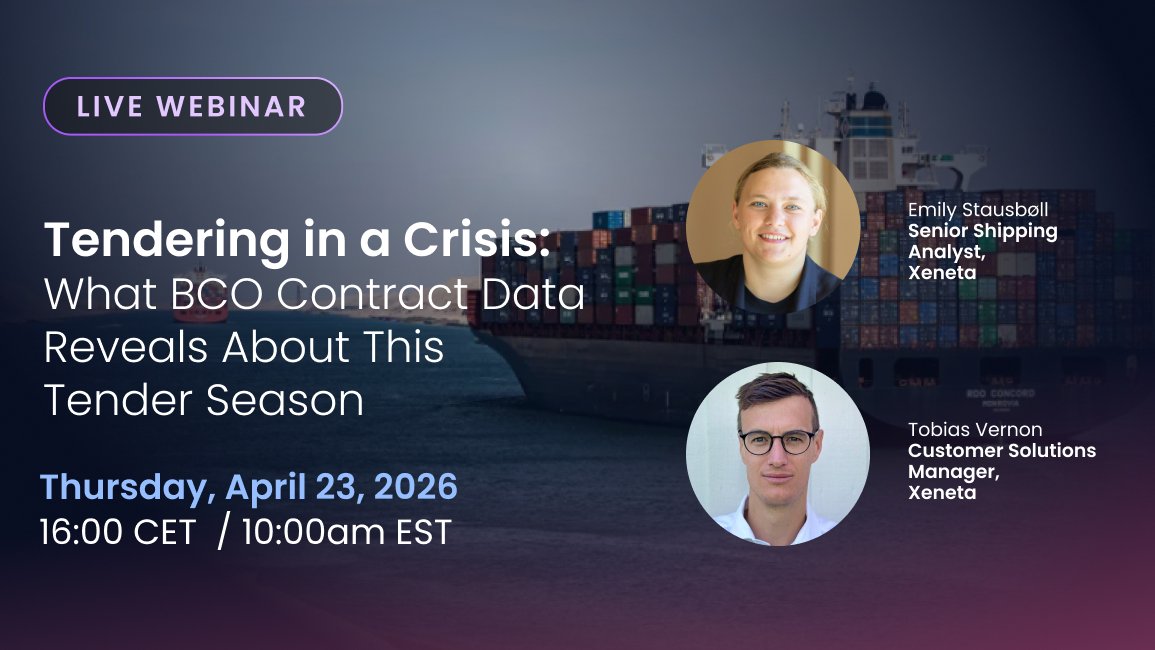
What BCO contract data reveals about this tender season.
Watch now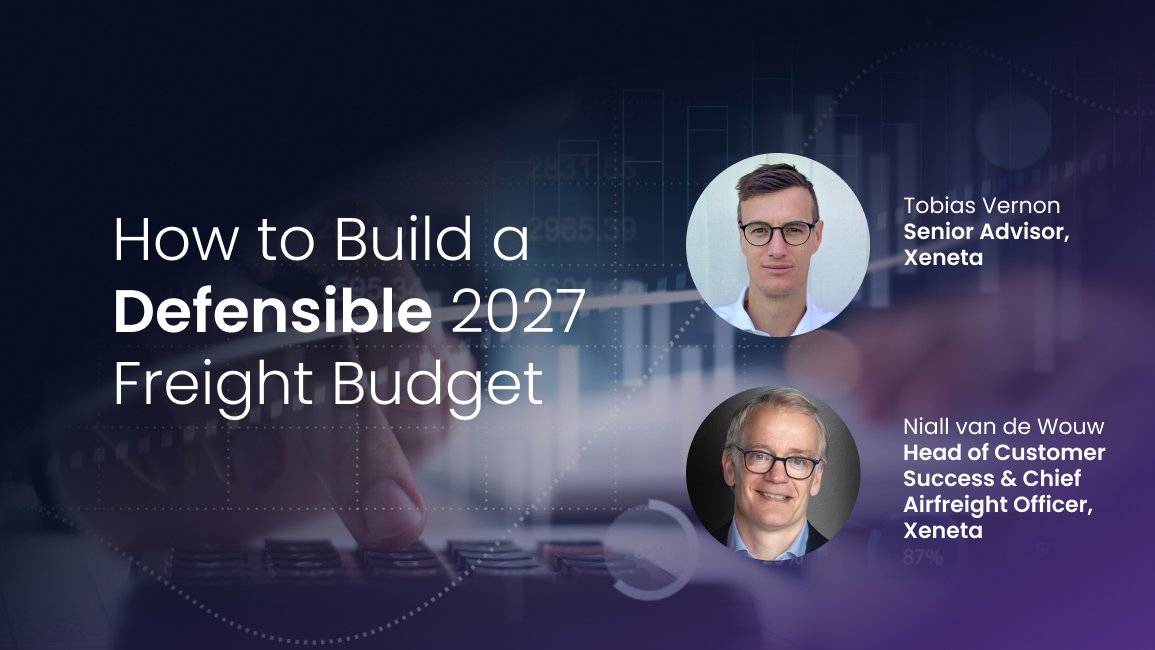
Build next year's freight budget on market data that stands up in front of finance.
Watch nowReal contracted and spot rates across 170,000+ port-to-port lanes, with market low, average and high segmented by contract type. Xeneta Ocean Schedules adds carrier-neutral service reliability data from AIS vessel tracking, including reliability rates, blank sailings and announced vs. actual transit times, so you can benchmark cost and service performance together.
Published indices aggregate rates across broad corridors, which is directionally useful but often too coarse for specific negotiations. Xeneta's benchmarks are built from contracted data companies actually paid, contributed by hundreds of shippers and forwarders, giving lane-level statistical depth relevant to the corridors that matter to you.
900 million+ rate data points across 170,000+ port pairs, strongest on high-volume corridors like Asia-Europe, Transpacific and Transatlantic, with growing coverage of Latin America, Africa and intra-Asia. The platform shows data confidence levels for niche or low-volume lanes.
Collected from a global network of shippers and forwarders, with a minimum of 5 rates per route/day/equipment type required before publishing. Rates reflect total port-to-port cost including BAF, CAF, canal and other surcharges, across six container types. All data is anonymized and aggregated; carriers cannot submit data, keeping Xeneta fully neutral.
Xeneta gives you Market Average, Market High, and Market Low for every lane, so you know what a competitive rate looks like before the conversation starts. Comparing the spot-to-contract spread gives you a data-backed case to renegotiate or hold.
Index-linked contracts automatically adjust rates against live market data over the contract's life. Xeneta's 900M+ rate dataset provides the neutral benchmark that makes this model work in practice.
Three bundles: Discover (rate benchmarking and spend analysis), Explore (adds carrier performance, predictive outlooks, and transit time analysis), and Achieve (full market coverage, unlimited AI agents, enterprise rate management, and dedicated customer success).
Lets teams upload bid sheets and benchmark carrier quotes across thousands of lanes at once. Available in Explore (up to 22,500 rows) and Achieve (up to 45,000 rows).
All bundles include onboarding support that scales with tier: Discover has in-platform guidance, Explore adds CSM sessions and quarterly reviews, and Achieve includes a dedicated customer success manager plus a 30-day onboarding workshop.
Yes. Our free ocean freight calculator compares what you pay per container with the long-term market average on your lane. It's based on 40ft dry container rates and updated monthly, so it's a directional read, not a quote. Lane-level detail lives in the full platform.