
Ocean freight rate calculator: see how your rate compares
Enter your corridor and what you pay per 40ft container. You'll get the long-term market average for that lane, so you know if you're paying above or below the market.
Trusted by the world's largest
shippers, forwarders, carriers and airlines.












Benchmark your lane
Benchmarks are based on 40ft dry container rates and are updated monthly from the Xeneta platform. Treat the result as a directional read on your lane, not a quote.
What your result actually tells you
The number you get back is the long-term market average per container on that corridor. Compare it against what you pay, and the gap tells you where to look next.
How ocean freight rates are calculated
The headline rate is rarely the whole cost. A common formula: (base rate + fuel surcharge + other surcharges) × containers + additional services.
Base rate
The core port-to-port cost of moving the container, set by lane and equipment type.
Surcharges
Bunker, security and currency charges (BAF, LSS, CAF, ISPS) that move apart from the base rate.
Terminal handling (THC)
Loading and unloading at each port, included in Xeneta benchmarks by origin and destination.
Additional services
Inland haulage, customs and D&D. Benchmarks exclude inland cost, so they stay like for like.
Why the number moves
Container rates swing on a handful of variables, and small disruptions travel a long way.
A starting point, not a negotiation
This calculator gives you one number for one corridor. A negotiation needs the range around it, where it's heading, and evidence you can show a supplier. That's where the platform comes in:
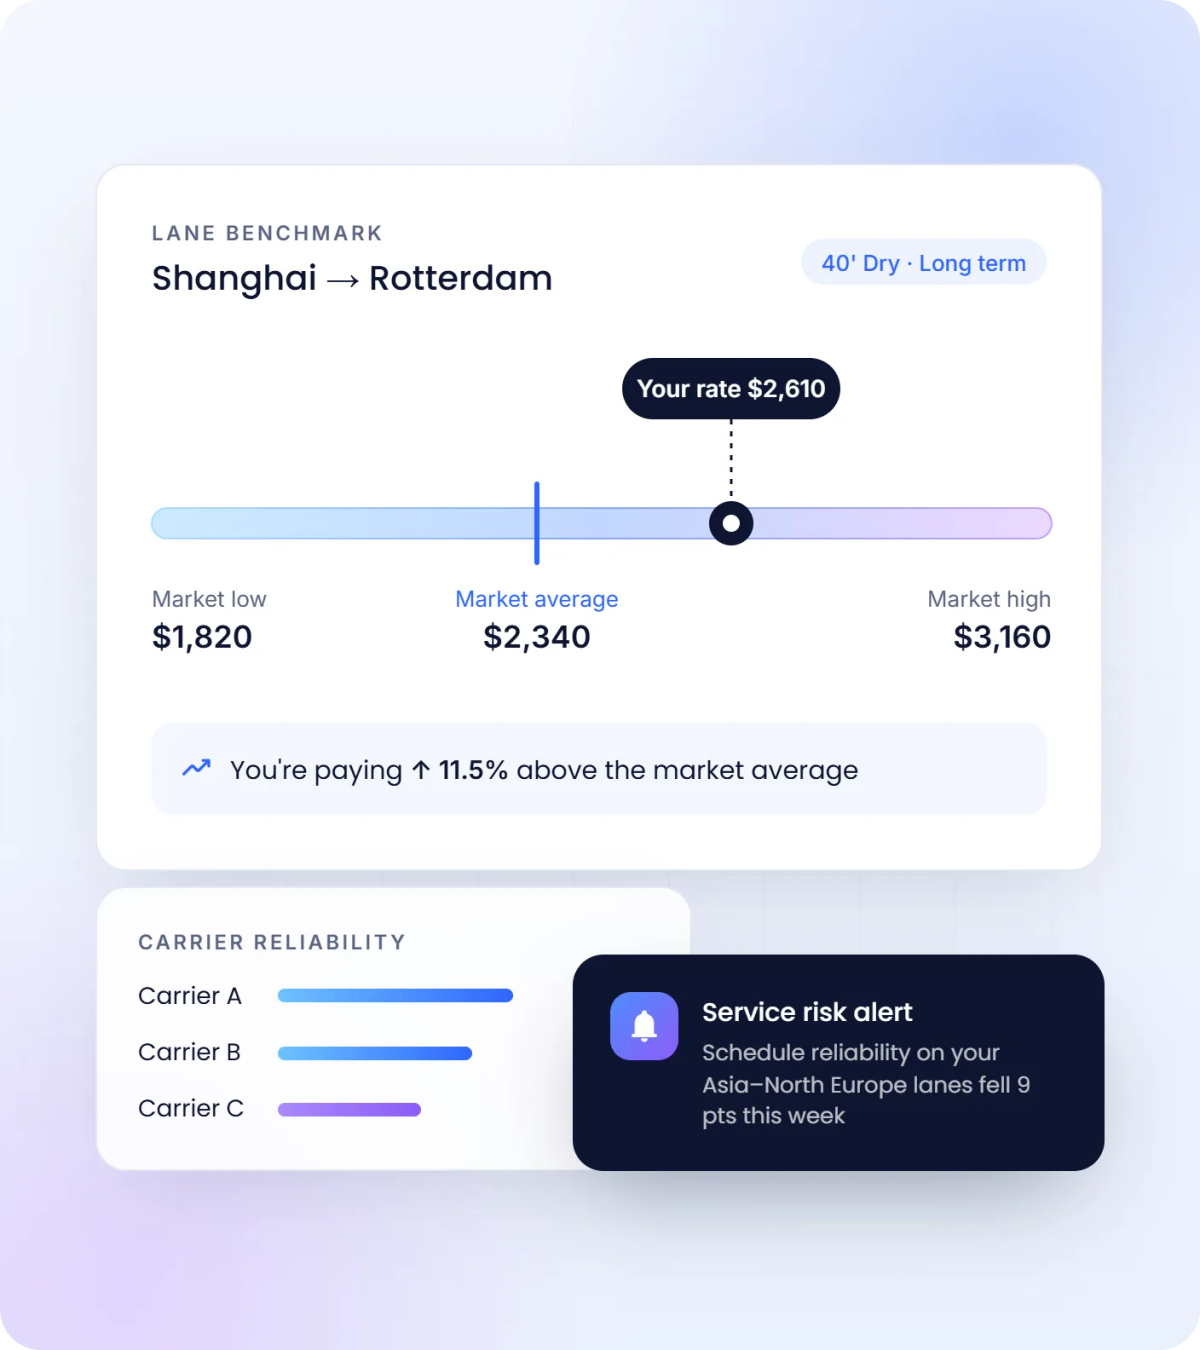
Market low, average and high, so you see the full spread on your lane
Spot and long-term rates by port pair and equipment type
Daily updates, with the capacity, reliability and surcharge data behind them
Your contracted rates benchmarked lane by lane, plus six-month forecasts
Related resources
A single lane average is a start. These take you from a directional read to the detail you can negotiate on.

Ocean freight outlook for 2026
Our analysts on where ocean rates, capacity and demand head for the rest of 2026.
Read the report
How shippers regain leverage
Our analysts answer 48 shipper questions on tendering in a carrier-led market.
Get the report
Container rates and carrier reliability
Where container rates and schedule reliability are heading, and what comes next.
Watch now
Build a defensible 2027 freight budget
How to set a freight budget that holds up when finance and the market push back.
Watch now
Why transpacific rates are near Covid peaks
Oil, typhoons, rerouting and peak season each played a part. Here's how they add up.
Read the article
Why every disruption now has a surcharge
What the data says about surcharge creep, and what shippers can do about it.
Read the articleFrequently asked questions
What does this calculator do?
It gives you an instant benchmark of your ocean freight cost against real market data from the Xeneta platform. Enter your shipping corridor and what you currently pay per container, and it shows how that compares to the long-term market average on the lane.
Benchmarks are based on 40ft dry container rates and updated monthly. It is a directional read on where you sit, not a quote for a specific shipment.
How are ocean freight rates calculated?
Rates are shaped by distance, cargo and equipment type, surcharges and current market conditions. A common way to express the cost is:
(Base rate + fuel surcharge + other surcharges) × containers + additional services
Base freight covers the port-to-port move. Surcharges include bunker, security and currency adjustment. Terminal handling charges cover loading and unloading at each end, and Xeneta includes these using a THC methodology set by origin and destination port. Additional services cover inland haulage, customs and documentation, plus detention and demurrage if containers sit too long.
What is included in a Xeneta benchmark?
Benchmarks cover port-to-port FCL rates including ocean freight related surcharges such as BAF, LSS, PSS, PCS, CAF and ISPS. Inland costs and non-ocean surcharges are excluded, because including them would make like-for-like comparison unreliable.
That definition matters: when you compare your contracted rate against the benchmark, you are comparing equivalent cost components rather than two differently constructed numbers.
Why are container rates so volatile?
Ocean freight sits at the centre of long, interconnected supply chains, so small disruptions travel a long way. Trade volumes shift pricing dynamics quickly. Vessel availability, blank sailings and port congestion all cut effective capacity. Bunker prices feed straight through into surcharge.
On top of that, conflict, canal restrictions and regulatory change reroute whole services, and peak periods before major holidays push rates up on their own. A monthly average smooths all of this; the platform shows you the movement underneath it.
Is this the same as a freight quote?
No. A quote is a price a specific carrier or forwarder will offer you for a specific booking, including their own handling and inland charges. This calculator gives you the market average per container for a corridor, so you can judge whether a quote you already hold is competitive.
Use it before the conversation with your provider, not instead of it.
Where can I see live ocean freight rates?
In the Xeneta platform, which is updated continuously across global ocean trade lanes. You get daily refreshed rate data, lane-specific benchmarks with market low, average and high, market trends and forecasts, and carrier and contract comparisons.
The Xeneta Shipping Index (XSI) is a useful high-level view of market direction, but it is designed to show overall movement rather than the specific, actionable rates a negotiation needs.
Where does Xeneta's ocean rate data come from?
From a global network of shippers and freight forwarders who contribute their real contracted rates, both short and long term, across major trade lanes. All contributions are aggregated and fully anonymized, and no company-specific information is ever disclosed.
Carriers, forwarders and NVOCCs cannot contribute rate data to the benchmarks, which is what keeps them independent. Every rate passes validation before publication. This calculator uses a simplified, monthly version of that dataset.
Do you have a calculator for air freight?
Yes. The air freight calculator gives you the same benchmark check for air cargo, based on standard service and shipments above 1,000 kg.