


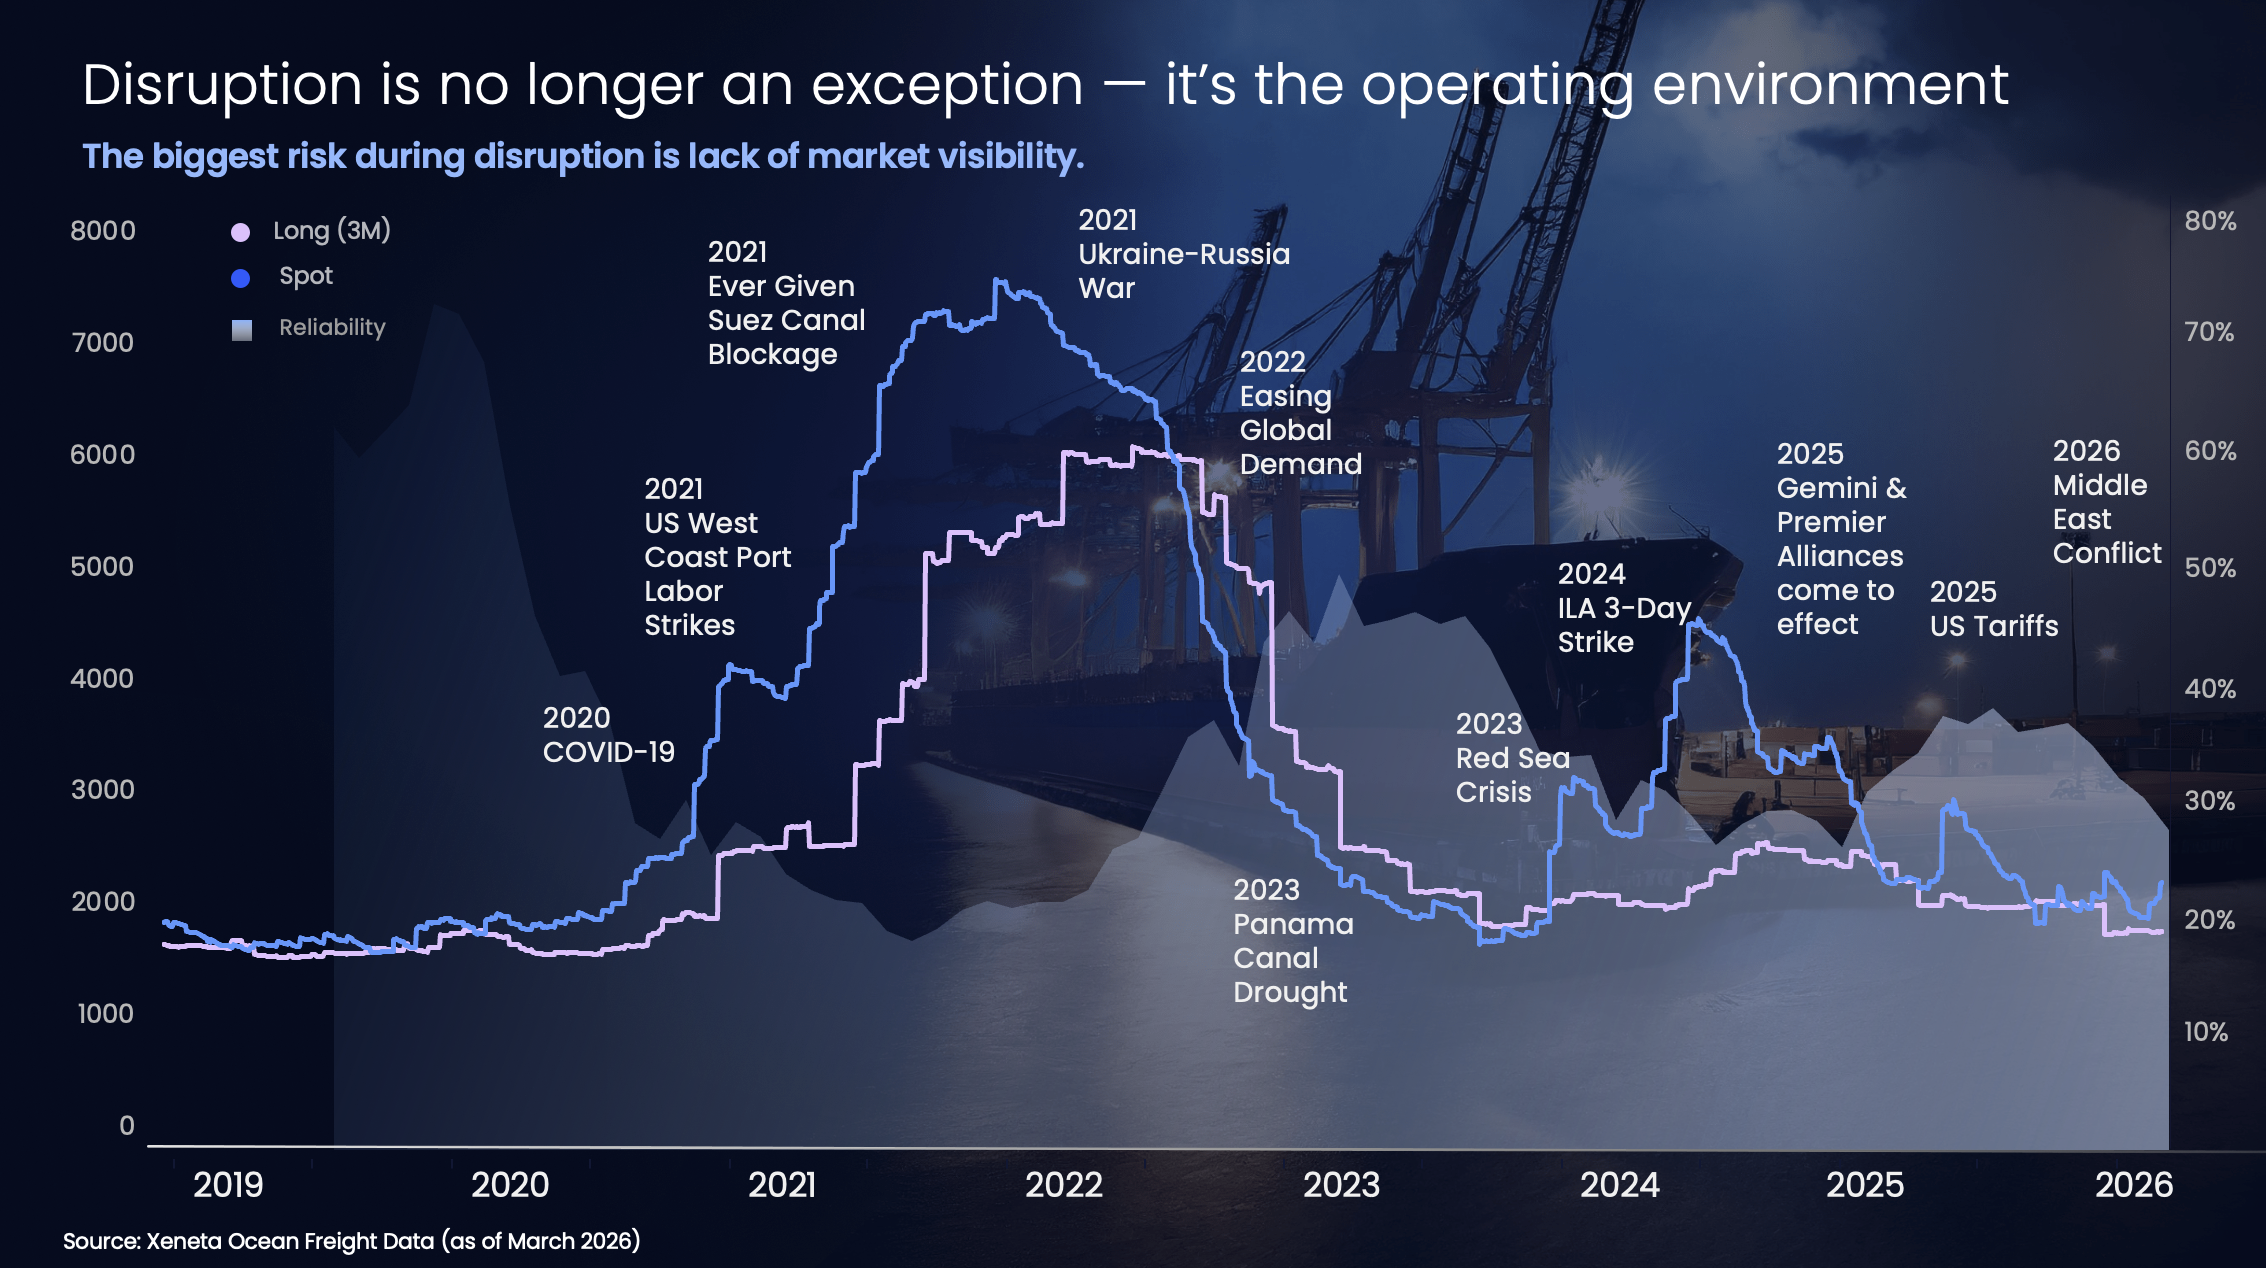
For most BCOs, 2026 was supposed to be a reset year.
Rates had been softening for months. The extreme volatility of recent years was easing. And critically, the industry had already adapted to disruption in the Red Sea — with supply chains recalibrated around longer routings via the Cape of Good Hope.
That cost had been absorbed. That complexity had been planned for.
After a year in which 96% of procurement teams experienced moderate or significant disruption — and 72% saw direct impact across their supply chains — many went into the 2026 tender season believing the worst was behind them.
Then the market shifted again.
This time, it is not just a continuation of the Red Sea disruption. With both the Red Sea and the Strait of Hormuz simultaneously blocked, the industry is facing a different kind of shock — one that hits both routing flexibility and fuel logistics at the same time.
It is a second-order disruption — hitting a system that had already adjusted once and forcing contracts to fall out of sync with operational reality.
Carriers are layering in emergency surcharges, transit times are shifting again due to rerouting, and procurement teams are being forced back into renegotiation — or met with radio silence — while explaining unplanned costs to finance and leadership.
And that's why many procurement teams now find themselves back in reactive mode, just as their contracts were being finalised.
A major part of that pressure is now playing out in bunkering — and it is being widely misunderstood.
The industry has already absorbed higher fuel costs over the past year. That is not new. What is new is that key refuelling hubs are no longer functioning normally: carriers cannot reliably access fuel where and when they need it.
Maersk’s CEO has spoken publicly about vessels transferring fuel to each other at sea just to ensure ships can reach ports where they can actually refuel.
That’s not a pricing problem. It’s a system under operational strain.
And yet, carriers are introducing emergency fuel surcharges — framing it as a cost issue.
That distinction matters.
If the constraint is operational and location-specific, the impact shouldn’t be uniform across all trades. Some routes are exposed. Others aren’t.
Without that nuance, you risk accepting charges that aren’t proportionate to the disruption actually affecting your supply chain.
This is where control starts to slip.
Costs you didn’t budget for start landing. Surcharges come in faster than they can be validated. Carriers push for changes — or go quiet altogether.
Meanwhile, finance and leadership still expect clear answers.
In that environment, reacting without data is how costs escalate.
The rest of this guide focuses on what to look at first, what to challenge, and how to make decisions while the situation is still evolving.
The Three Things That Matter in a Crisis
Before diving into specific tools and data sources, keep this framework in mind. The shippers who navigate disruption best tend to do three things well:
- Keep cargo moving. Cost mitigation matters, but it comes second to keeping goods flowing. The cost of empty shelves, lost sales, stopped production, or damaged customer relationships is almost always greater than the cost of moving freight at a temporarily higher rate.
- Know your budget and your exposure. You cannot make good decisions without visibility on what you can absorb, where you are exposed, and how much P&L pressure the business can realistically take.
- Protect the P&L deliberately, not reactively. Some costs will have to be accepted. But they should be accepted because you understand them, not because you were caught without the data to challenge them.
Crisis Checklist: What to Use and When
| Timing | Action | Xeneta Feature |
|---|---|---|
| Immediately | Monitor critical trade lanes in one view | Market Trends → Watchlists |
| Day 1 to 3 | Understand if rates on your lanes have actually moved | Ocean Monitor → Market Benchmarks |
| Day 1 to 3 | Challenge any new surcharges with data | Ocean Monitor → Surcharges + BAF Calculator |
| Week 1 | Identify which contracted rates are at risk | Analyze → Your Rates vs. Market |
| Week 1 | Evaluate carrier reliability before rebooking | Ocean Schedules + Carrier Scorecard |
| Week 1 to 2 | Check blank sailings and forward capacity | Ocean Monitor → Capacity |
| Week 1 to 2 | Get market context and peer intelligence | Xeneta Advisory |
| Week 2 to 4 | Refresh internal freight budget estimate | Budget Outlook → Re-estimate (short & long term) |
| Post-crisis | Build case for indexed/flexible contracts |
Analyze → Indexing |
Step 1: Set Up Your Watchlist and Track Critical Trades
Use: Market Trends → Watchlists
When: From day one of a disruption, and ideally before the next one hits.
What to do:
- Build a watchlist of your critical trade lanes so you get immediate visibility when rates or conditions shift
- Set up Market Trends monitoring on those specific corridors to track rate direction, spread widening, and emerging volatility without having to manually pull data each time
- Use the trends view to spot patterns early. A gradual rate creep across multiple lanes simultaneously is often a leading signal of a broader market move, not a lane-specific issue
Why this matters in a crisis: When disruption hits, your attention is fragmented. A well-configured watchlist means you are not starting from scratch every time. Your most important lanes are already surfaced, and you can see at a glance which are moving and which are stable. That triage capability is what separates a controlled response from a reactive one.
Step 2: Understand What's Actually Happening in the Market
Use: Ocean Monitor → Market Benchmarks
When: The moment disruption hits and you need to understand whether market rates have genuinely moved, or whether carriers are using the crisis as cover for broader increases.
What to do:
- Pull short-term and long-term rate benchmarks on your key trade lanes
- Compare where rates sit today against your contracted rates
- Look at the spread between market low and market high. A widening spread signals volatility, but it also signals negotiating room
- Drill into port-pair level detail to see exactly which lanes are genuinely under pressure vs. those being swept into broad carrier narratives
The critical question to answer: Are rates rising because of genuine market pressure on your specific trade lanes, or are carriers applying broad surcharge logic to routes that are not actually affected?
For example, if bunker surcharges are appearing on trades far removed from the conflict zone, Market Benchmarks will show you whether spot rates on those lanes have actually moved. If they have not, you have the data to push back. Not an opinion, a market fact.
Step 3: Scrutinise Every New Surcharge
Use: Ocean Monitor → Surcharges & BAF Scenario Calculator
When: Every time a carrier introduces a new charge during the disruption, whether that is a bunker adjustment factor, emergency fuel surcharge, war risk premium, or port congestion fee.
What to do:
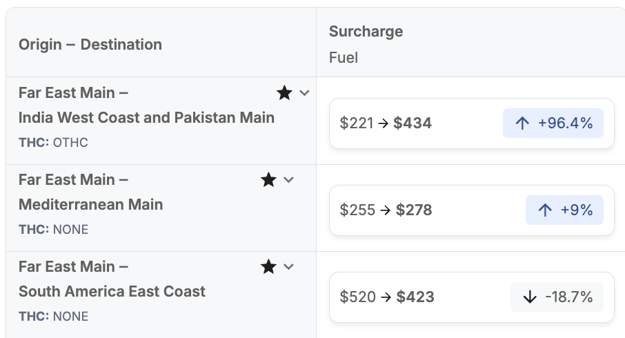
- Review surcharge data broken down by trade lane and carrier to see how charges are shifting across the market
- Use the BAF Scenario Calculator to model the actual fuel cost impact on your specific lanes. This is especially important when carriers are pushing emergency fuel surcharges on top of existing BAF mechanisms
- Check whether you are already absorbing cost through existing bunker mechanisms and identify if similar pressure is being recovered twice under different labels
- Compare surcharge levels across carriers on the same trade. Significant disparity is often a sign that not all of it is operationally justified
The key discipline here: Remember that the core bunkering issue right now is operational, with carriers struggling to access fuel in specific locations, not simply a global fuel price increase. If a carrier is framing a surcharge as an emergency price measure on a trade that is not directly affected by the operational disruption, that deserves scrutiny. The BAF Scenario Calculator gives you an independent, data-grounded view of what fuel cost recovery should actually look like on your trade lanes. If a carrier's emergency surcharge goes well beyond what the calculator indicates, that is the conversation to have.
And as Antonio Schiano-Lomoriello, Lead Value Engineer at Xeneta and a former shipper-side procurement professional, puts it:
"When procurement teams have no time and no buffer, they will accept whatever comes their way just to keep things moving. That urgency is understandable, but it is also exactly how cost transparency breaks down. Data is what separates legitimate cost recovery from opportunistic pricing."
Step 4: Assess Your Contracted Rate Exposure
Use: Analyze → Your Rates vs. Market
When: Before any renegotiation conversation with a carrier.
What to do:
- Upload your contracted rates and overlay them against current market benchmarks
- Identify which lanes are now above market (where carriers will push hardest) and which are below (where you still have leverage)
- Prioritise where to focus renegotiation energy. Not every lane needs the same level of attention
Why this matters: In a crisis, procurement teams often feel pressure to renegotiate everything at once. Xeneta's rate benchmarking helps you triage: which contracts are genuinely under water, and which carriers are simply testing your resolve?
Step 5: Evaluate Carriers Before Rebooking
Use: Ocean Schedules, Carrier Scorecard & Transit Time Data
When: You need to reroute cargo, switch carriers, or assess alternatives quickly.
What to do:
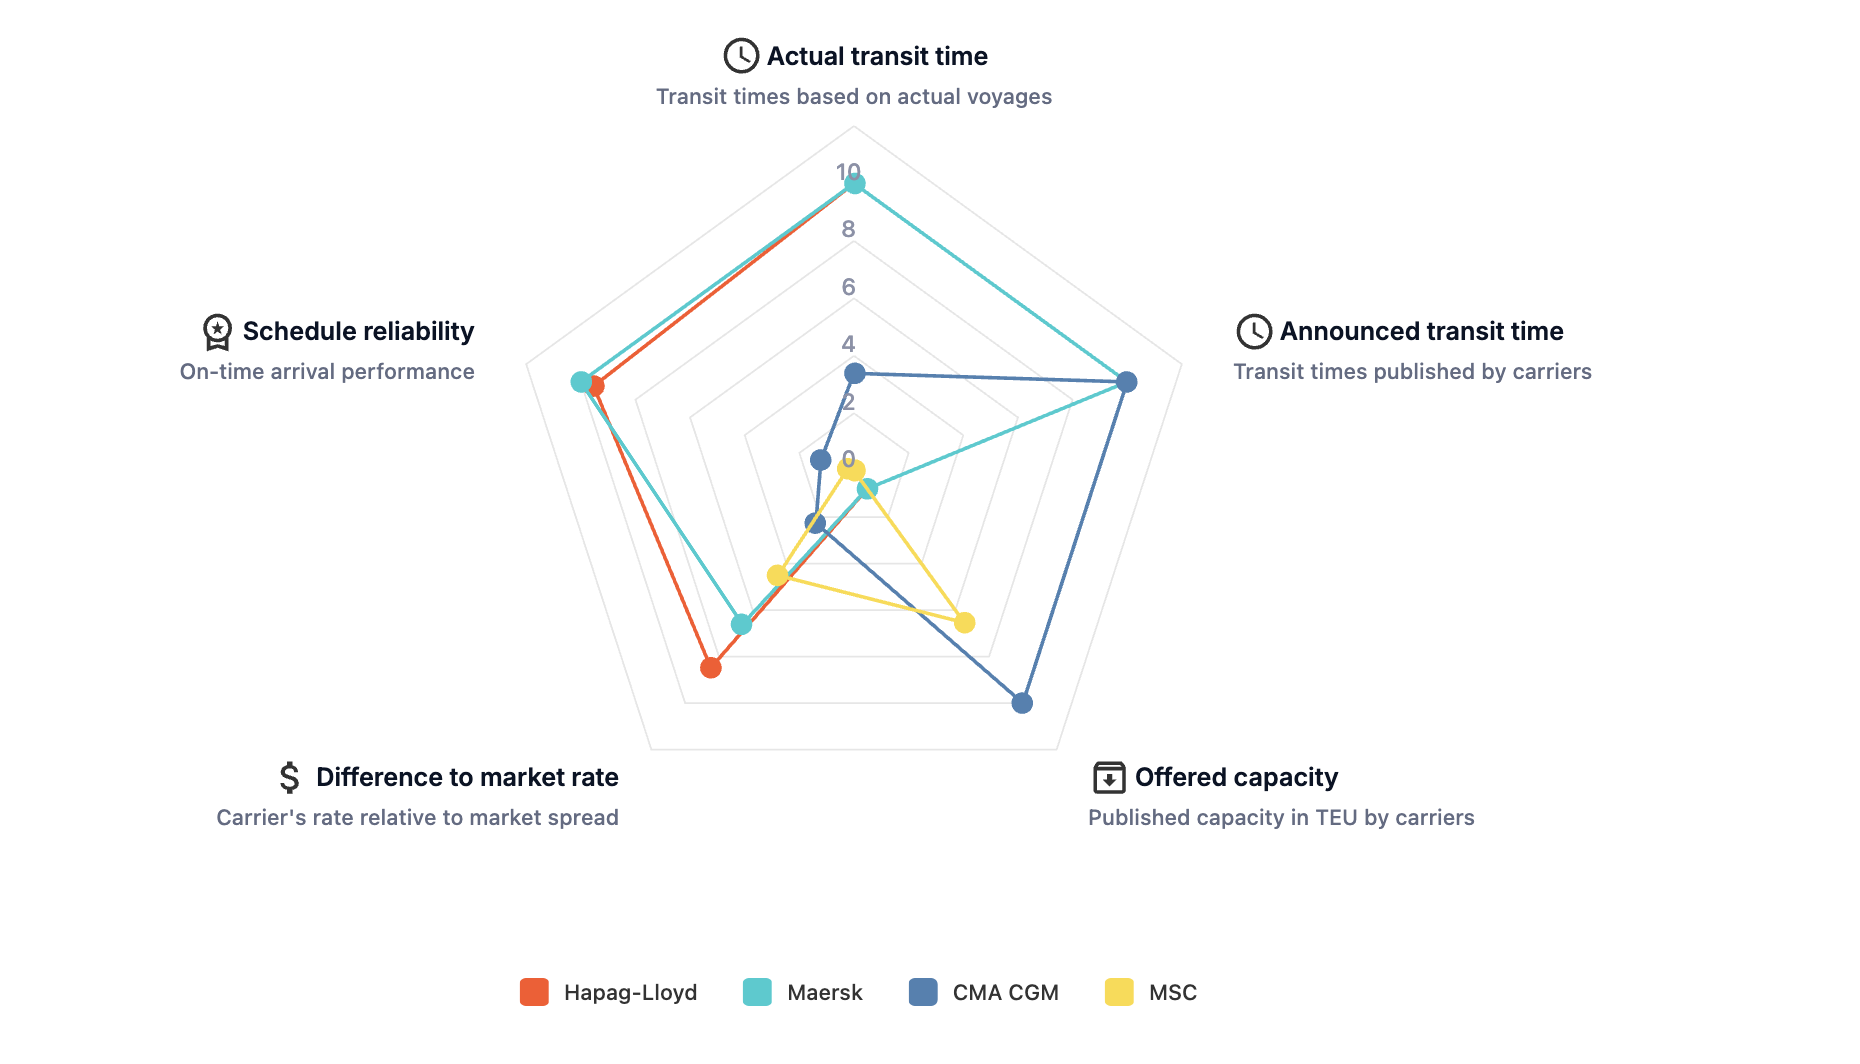
- Open the Carrier Scorecard and filter for your relevant trade lanes
- Compare reliability, actual vs. proforma transit times, and cancellation rates side by side
- Do not just pick the cheapest alternative. In a crisis, an unreliable carrier that is 10% cheaper can cost far more in delays, rebooking fees, and downstream disruption
What the data shows: Carrier performance diverges significantly during disruption. On the Far East to North Europe corridor, for instance, some carriers have consistently outperformed on reliability while others have struggled. A cost-focused view tells a completely different story. Knowing which lens matters for your shipment is the difference between a smart decision and a reactive one.
For blank sailings specifically, use the Blank Sailings tracker to identify gaps in sailing schedules before booking, and look for patterns (repeated gaps in the same slot) rather than treating each blank sailing as an isolated event.
Step 6: Understand Capacity Before Committing
Use: Ocean Monitor → Capacity & Blanked Sailings
When: Planning forward shipments and assessing whether your carrier will actually have space and schedule integrity over the next 8 to 12 weeks.
What to do:
- Review the offered vs. blanked capacity chart for your key corridors
- Look at the forward forecast. A high volume of upcoming blanked capacity is a signal to either secure bookings early or build in alternative routing options
- Cross-reference with the capacity waterfall dynamic: a single delayed vessel in a 12-vessel loop can erode a significant share of effective capacity through compounding schedule delays
The practical output: You want to walk into any carrier conversation knowing whether they are genuinely constrained or not. If capacity is being blanked aggressively on your trade, that changes your negotiating posture entirely.
Step 7: Rebuild Your Budget Estimate
Use: Budget Outlook Tool → Re-estimate & BAF Scenario Modelling
When: After the initial disruption stabilises enough to re-forecast, typically within 2 to 4 weeks of a major market event.
What to do:
- Use the Re-estimate function to rebuild your freight spend forecast based on current short-term and long-term market rate trajectories, rather than the contracted rates your original budget was built on
- Layer in the BAF Scenario Calculator to show how fuel cost movements compound the rate impact on your total spend
- Use this output as the basis for a revised freight budget conversation with finance, with independent market data behind every assumption, not carrier quotes
Why this matters: The shippers who stay in control during a crisis are the ones who know their exposure. A refreshed budget built on current market benchmarks, not stale contracted rates, is what lets you make deliberate decisions rather than reactive ones. Without it, every new charge feels bigger than it is, and that is when panic takes over.
Step 8: You Don't Have to Navigate This Alone
Use: Xeneta Advisory Services
When: When you need more than data. When you need to understand what is actually happening across the market and what your peers are doing right now.
What Advisory provides:
- Analyst-led intelligence on how the current disruption is playing out across different trade lanes, carrier strategies, and shipper responses
- Context on what other BCOs and procurement teams are accepting, challenging, and renegotiating in this specific crisis, so you are not making decisions in isolation
- Support translating Xeneta data into executive-ready recommendations for leadership and finance stakeholders who need answers fast
Why this matters right now: When a crisis hits mid-tender cycle, the questions get harder fast. Is this surcharge level normal? Are other shippers accepting these terms? What are carriers actually willing to do when pushed? These are not questions data alone can always answer, but your Xeneta advisors are talking to the market daily and can give you that broader perspective precisely when you need it most.
If you are feeling the pressure of making big decisions without enough visibility, that is exactly the moment to reach out.
Step 9: Build the Case for Indexed Contracts
Use: Analyze → Indexing & Contract Performance
When: Once you are through the immediate crisis and starting to think about the next tender cycle.
What to do:
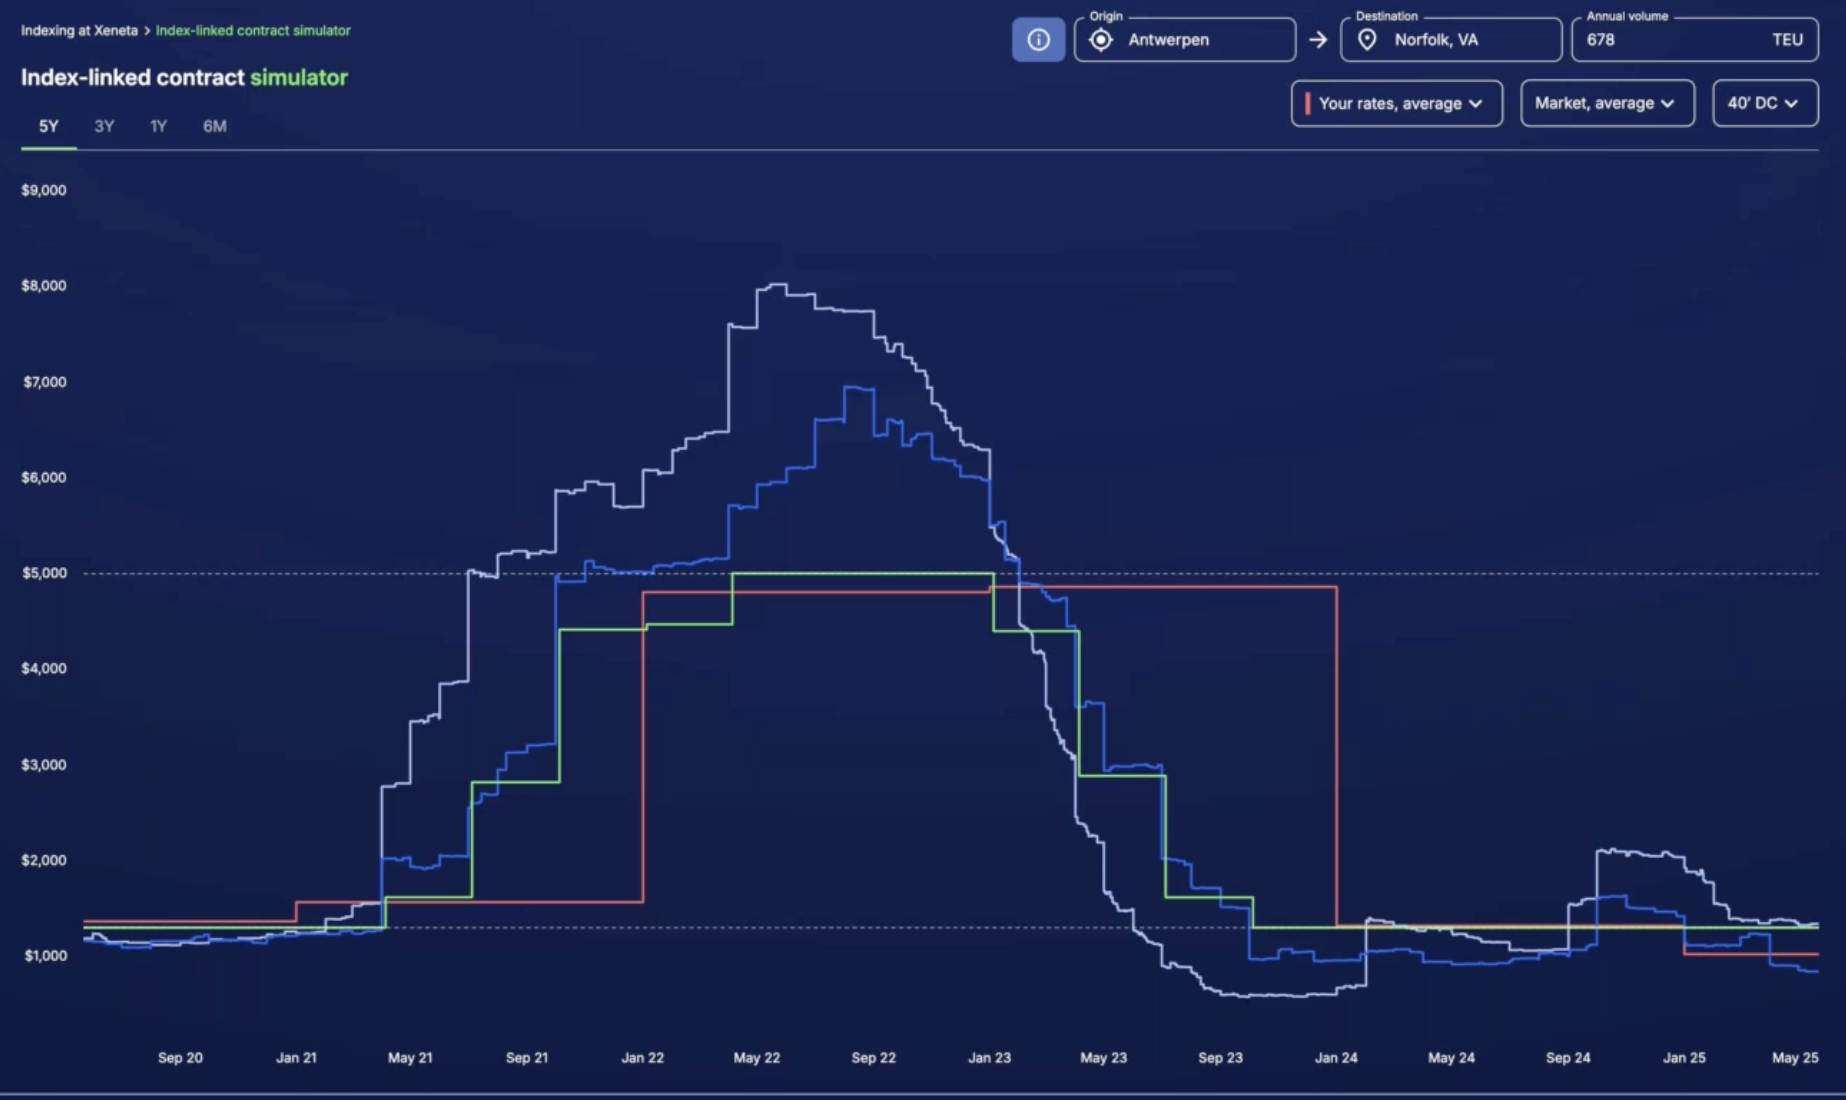
- Use Xeneta's indexing tools to model what an indexed contract would have looked like for your top lanes over the disruption period vs. your fixed-rate contract
- Identify where full-year fixed contracts became paper rates, in name only, with no practical availability
- Use this analysis to make the internal case for a more flexible contract structure next cycle
The structural point: Fixed annual contracts are designed for stability, but that stability depends on the market holding. When conditions shift, contracts can decouple from reality — with agreed rates no longer reflecting what’s actually achievable.
Indexed contracts move with the market, helping maintain alignment as conditions change. When combined with hedging approaches, they can also support more stable budgeting and reduce P&L volatility.
Take Control Before the Next Surcharge Lands
Disruption raises the cost of getting decisions wrong.
Unchallenged charges build quickly across trades and over time. By the time they’re reviewed, the impact is already in your numbers.
The shippers who navigate disruption best are not those with the strongest pre-crisis assumptions. They are the ones with full visibility into what’s impacting their supply chain, where costs are justified, which carriers are reliable, and where their P&L is exposed.
Xeneta doesn't make the market less volatile but we do make sure you are never negotiating in the dark.
If you are short on time or need hands-on support navigating the current disruption, our Advisory team can help. They work with shippers across industries every day, providing analyst-led market intelligence, peer benchmarking, and strategic guidance tailored to your specific trades and challenges. Explore Xeneta Advisory


