
Multi-metric comparison
Reliability, capacity, emissions and rates for every carrier, from one source.
Score ocean carriers side by side on reliability, capacity and emissions. No manual work. No bias.
Trusted by the world's largest
shippers, forwarders, carriers and airlines.












Without objective performance data, teams default to rate-driven decisions and miss chances to optimise.
Reliability, capacity and emissions sit in separate systems, or aren't available at all.
Experience, recency and carrier-provided stats lead to inconsistent choices by lane.
Procurement, operations and logistics each work from different data sets.
Pick the metrics that matter, weight them, and see which carriers come out on top.
Carrier Scorecard ranks ocean carriers on the metrics you choose, so every call is backed by evidence.
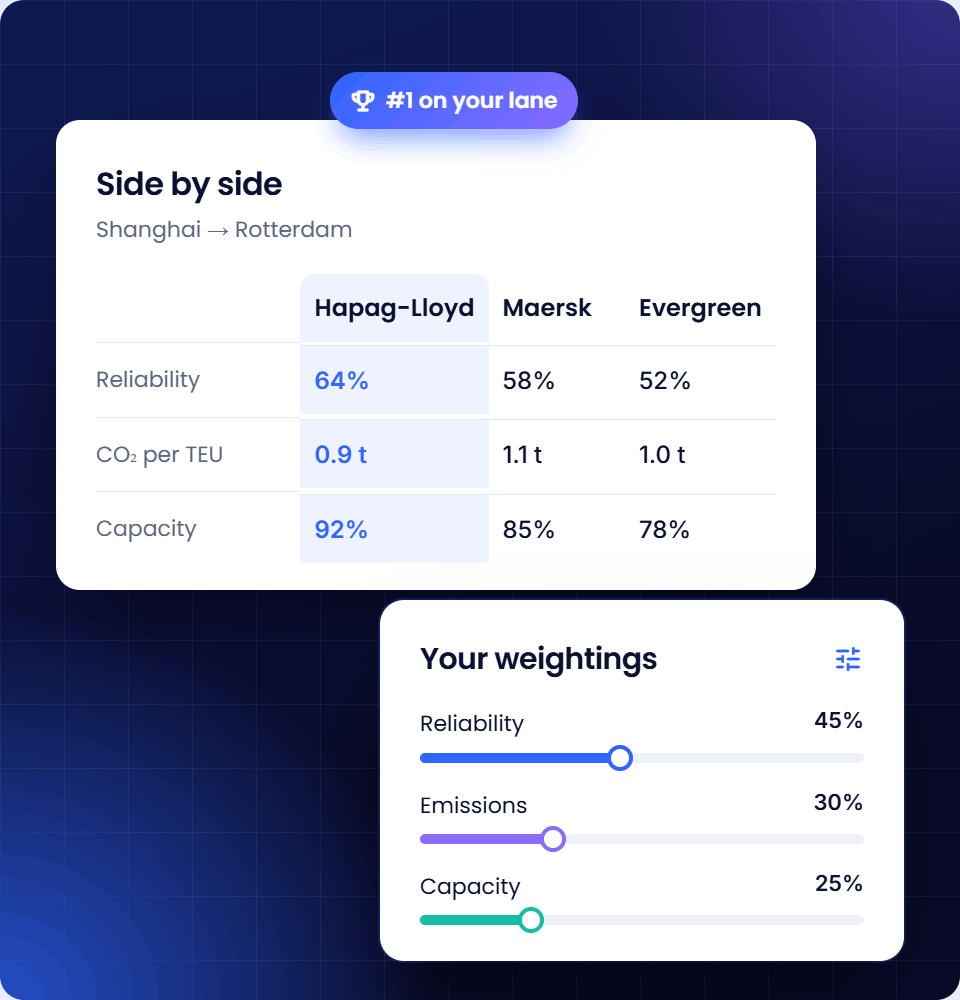
Compare reliability, emissions and capacity to find the carriers that perform beyond price.
Reliability, emissions and capacity side by side
Weightings set to your priorities
Rankings on your key trade lanes
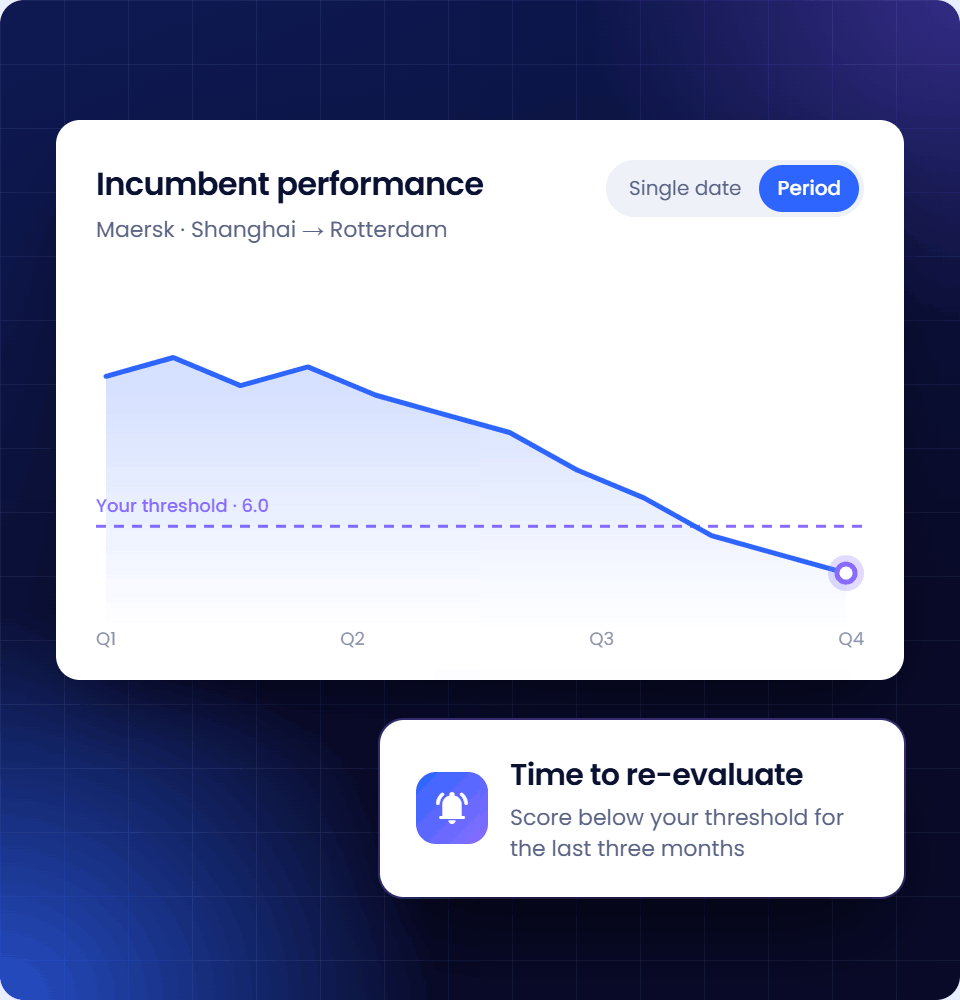
Track how incumbent carriers perform over time and spot when a relationship needs a second look.
Incumbent performance tracked over time
Scores on a single date or over a period
Clear signals for when to re-evaluate
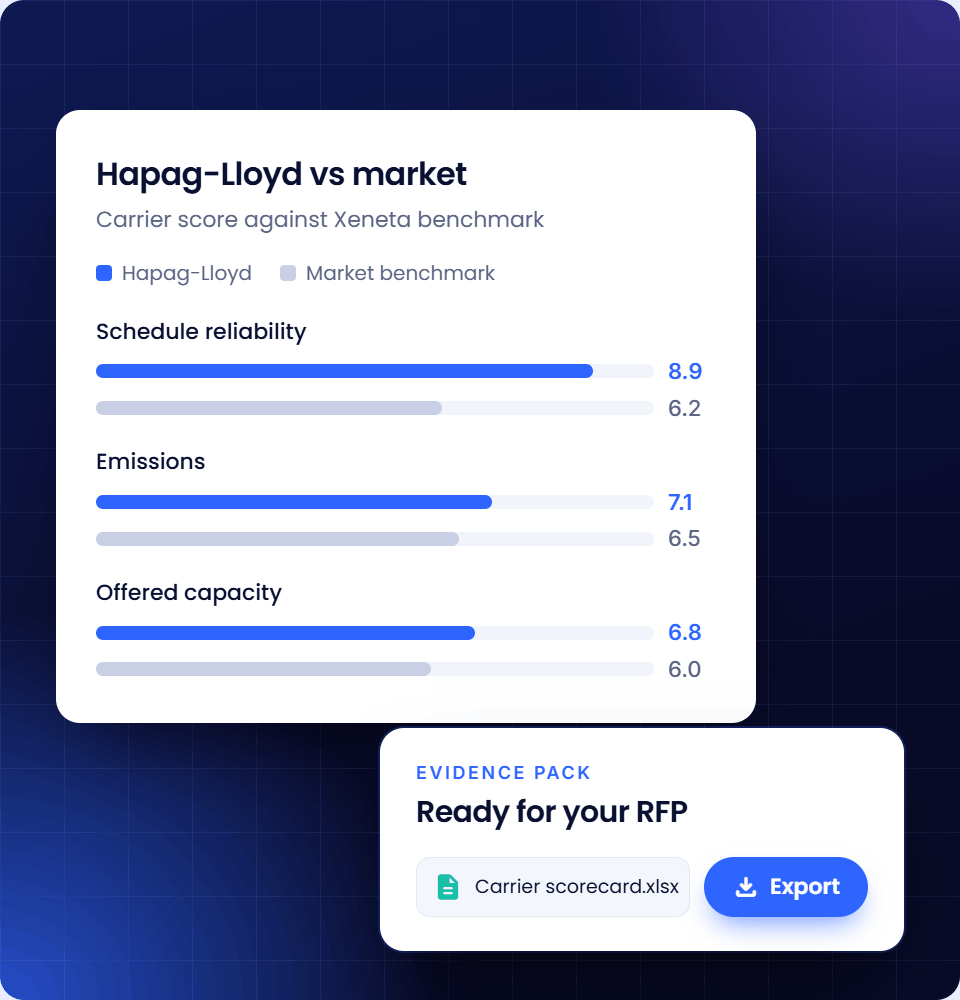
Build evidence-based arguments for switching, awarding or expanding your carrier portfolio.
Evidence for awarding, switching or expanding
Exports ready for RFP documents
Scores next to Xeneta market benchmarks
Reliability, capacity, emissions and rates for every carrier, from one source.
Start from a preset template or set the metrics and weightings you need.
Rank carriers visually or in a table for fast, confident evaluation.
Compare performance on a single date or over a period to see trends.
Share scorecards or export visuals for RFPs, negotiations and reporting.
Connected to Xeneta market benchmarks and analytics in one platform.
Our analysts answer the 48 questions shippers raised at our recent roundtables, so you can go into your next tender with a plan.
Get the report
Carrier Comparison Scorecard is built for ocean freight procurement teams who need objective, multi-metric insight into carrier performance. It suits mid-to-large shippers with multi-carrier strategies across several key trade lanes.
It replaces subjective, rate-only decisions with transparent comparisons across reliability, emissions, capacity and other performance metrics, all in one place.
Benchmarking shows how your rates compare to the market. Carrier Scorecard adds performance indicators, custom weightings and side-by-side rankings, so you see each carrier beyond price.
Every user sees relative rankings across metrics. Customers who subscribe to datasets such as Reliability, Transit Times, Emissions and Capacity see the full metric values.
Yes. Scorecards give you clear, defensible evidence for awarding, switching or expanding carrier allocations. Export visuals and tables to align stakeholders or use them directly in RFPs.
Yes. Carrier Scorecard sits inside the Xeneta platform and connects to Ocean Monitor and Market Benchmarks.
Performance data updates continuously from Xeneta's datasets. Generate a scorecard for a single point in time or over a historical period to review trends.