
.jpg)


Latest Xeneta ocean container shipping data highlights are provided below quotes from Xeneta Chief Analyst Peter Sand.
Xeneta has also published a dedicated webpage with the latest updates on the Middle East conflict including a live port congestion map.
Xeneta analyst insight
Peter Sand, Xeneta Chief Analyst
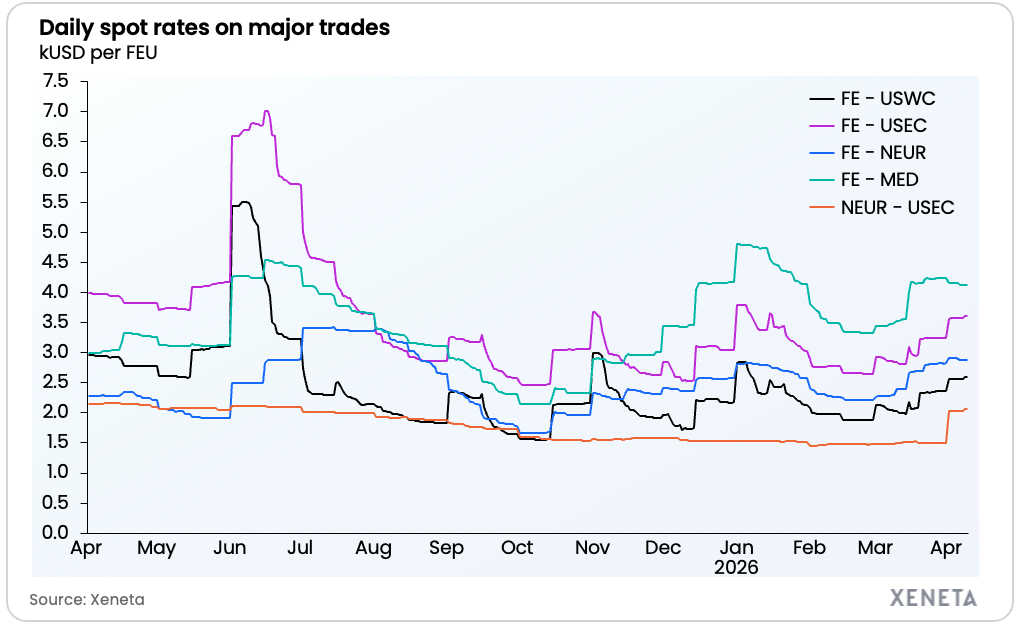
“Ocean container freight rates can appear to move in mysterious ways, demonstrated by the most dramatic increases across the world’s major fronthauls since escalation of conflict in the Middle East being found on trades that do not transit the region – the Transpacific from Far East to US West Coast and Transatlantic from North Europe to US East Coast.
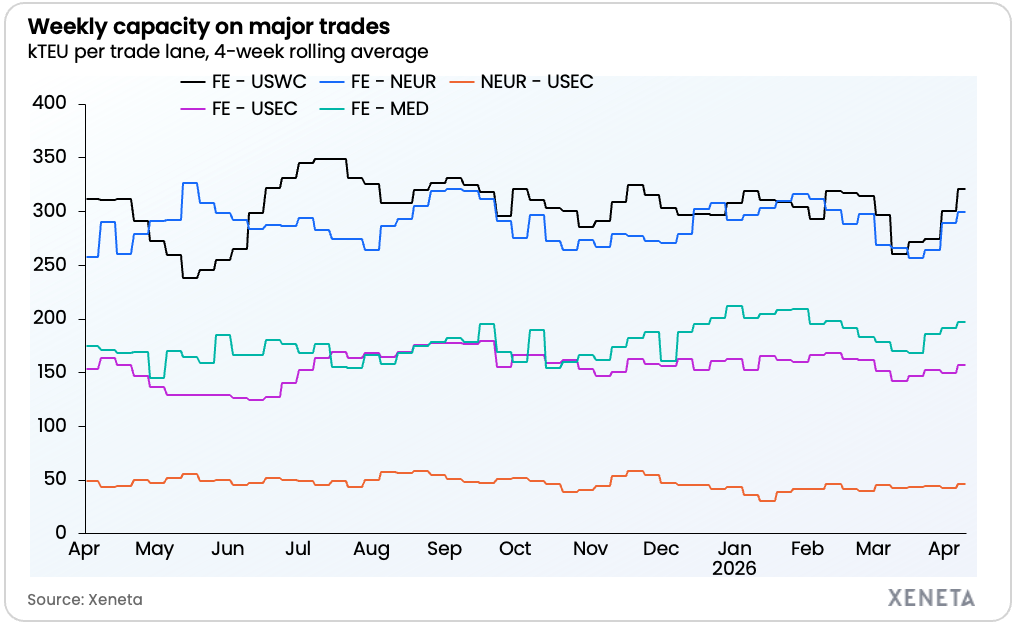
“If the reason given to shippers for spot rate increases of more than 40% on these US-bound trades since the end of February is a tightening of capacity, the data shows this doesn’t hold much water. There is nothing spectacular happening with offered capacity or blanked sailing on the Transpacific or Transatlantic trades that would suggest rate increases of this magnitude.
“The explanation is partly found in market sentiment, with the Middle East conflict creating a sense of unease with shippers globally. The other major factor behind the rate increases is emergency bunker surcharges. These are global applicable surcharges, meaning shippers can still be hit even if their containers never go near the Middle East.
“This underlines the global impact of the Middle East conflict, but until there is a ceasefire that provides assurance of ongoing safety for seafarers, ships and cargo, we should expect disruption to continue.”
Data highlights
Market average spot rates – 10 April 2026
-
Far East to US West Coast: USD 2,645 per FEU (40ft container)
-
Far East to US East Coast: USD 3,662 per FEU
-
Far East to North Europe: USD 2,854 per FEU
-
Far East to Mediterranean: USD 4,107 per FEU
-
North Europe to US East Coast: USD 2,093 per FEU
Average spot rates compared to pre-Middle East conflict escalation on 28 February
-
Far East to US West Coast: +41%
-
Far East to US East Coast: +38%
-
Far East to North Europe: +29%
-
Far East to Mediterranean: +23%
-
North Europe to US East Coast: +42%
Offered capacity (4-week rolling average) – w/c 6 April 2026
-
Far East to US West Coast: +6.9% from a week ago
-
Far East to US East Coast: +5.0% from a week ago
-
Far East to North Europe: +3.5% from a week ago
-
Far East to Mediterranean: +3.3% from a week ago
-
North Europe to US East Coast: +7.3% from a week ago
Ends
Journalists can be added to the distribution list for Xeneta Weekly Market Updates by emailing press@xeneta.com.


