On behalf of Xeneta, I am proud to announce two pieces of fresh news: 1) we now have over 45 million datapoints in our platform, a 161%data growth in 12 months and 2) the launch of our revamped Xeneta application.
More Container Rates | 161% Data Growth in 12 Months
Data is our most precious currency; the crux of our business. We are happy to announce that we have reached another data milestone. As of today, the Xeneta platform has 45+MN rate data points. We are adding over 2MN rates a month from global shippers and freight forwarders to the platform. This includes both spot and long-term rates with our strength in the contracted/long-term rates market.
If we look back at the beginning of 2017, we have increased the # of rates in our platform by 161% in 12 months. Congratulations team Xeneta!
Revamped User Interface
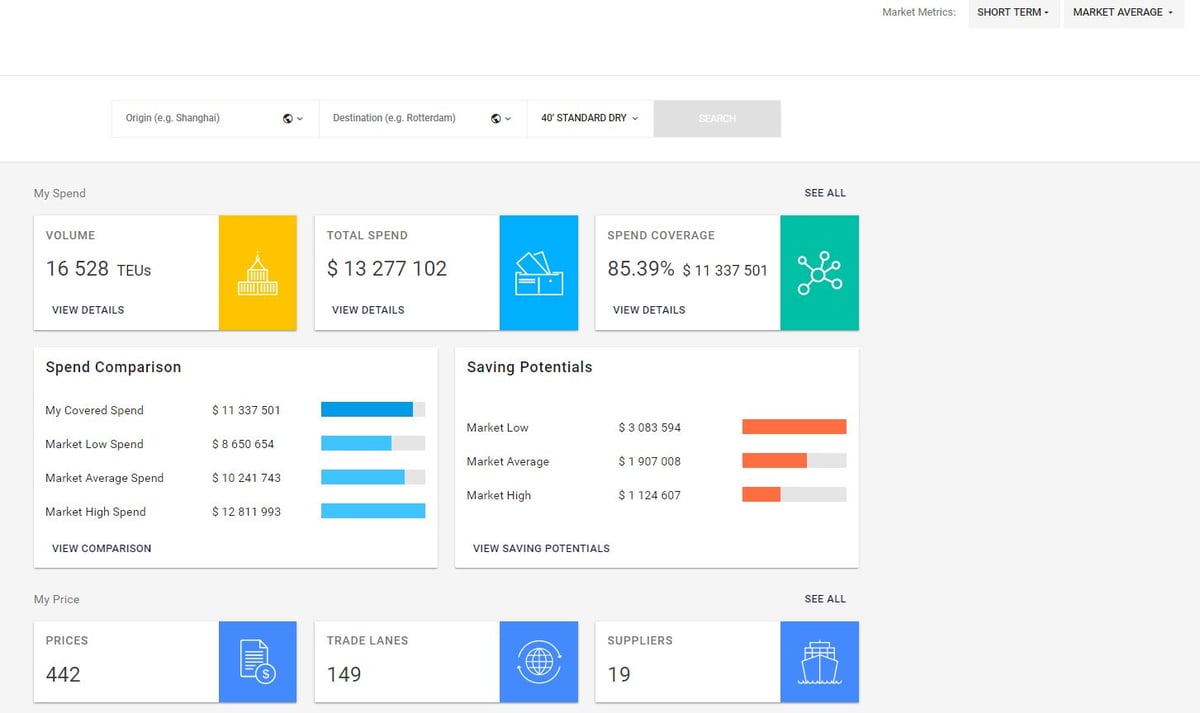
For about a year, our Engineering and Product teams have been re-designing and developing the improved application user interface with the main goal in mind to create a platform that is better suited to meet our customers' evolving needs.
What was of utmost importance in this process was to bring our Product and Engineering teams closer to our customers. We did so by staging tens of interviews and live demonstration sessions, collecting hundreds and hundreds of invaluable comments and requests and then analyzing how different customers interact with our platform.
The end result is a fantastic new application that is more user friendly, improved advanced visualization with all data information in one place.
[CLICK TO ENLARGE]


Improvements & Benefits:
- Ability to compare the behavior of the spot and the long market rates in one graph and really understand how and when the spot market influences the long-term contracted rates.
- Addition of calculated feeder rates which display the implied market from/to the small European and Asian Ports. This gives you new insight into these smaller markets and simultaneously extends the coverage of the Xeneta platform.
- Addition of rates for new equipment types: refrigerated containers and tanks.
- Re-design of the spend comparison table which provides our customers a faster, more integrated and more intuitive way of comparing their cargo spend to market rates.

- Increased platform capability of handling even larger amounts of data both from the technical side and from a data-loading perspective for the user
- Ability to bookmark and save all pages of the platform for future work or to share it with a colleague
What's Next
We're not done. Our platform is constantly evolving and we have built it in a way that it can grow effortlessly over time. Some early hints of what is to come can already be seen in the quickly developing global trends and reporting functionalities. Stay tuned for what comes next!
Roll Out
Our existing customers have been invited to various new UI training sessions hosted by our Customer Success and Product teams. The sessions will introduce the new functionality and go through a change list of what is new and improved.
If you are not a Xeneta customer yet, but are interested in learning more and seeing our new UI in action, please request a demo here and we'll get back to you shortly.
You can also see our new UI in action in our latest quarterly rates webinar here.