


Welcome to Xeneta’s Reliability Scorecard – a Year in Review. This week we’re wrapping up the best and worst of alliance reliability in 2025, to be followed by carriers.
Our yearly alliance rankings didn't hold any surprises against the month-over-month developments that we published throughout the year, but there was still much to be learned. What stands out the most is the stark contrast between the two new alliances of 2025, and how decisions made in their early conception shaped everything that followed.
Average Alliance Reliability Ranked from Best to Worst, 2025
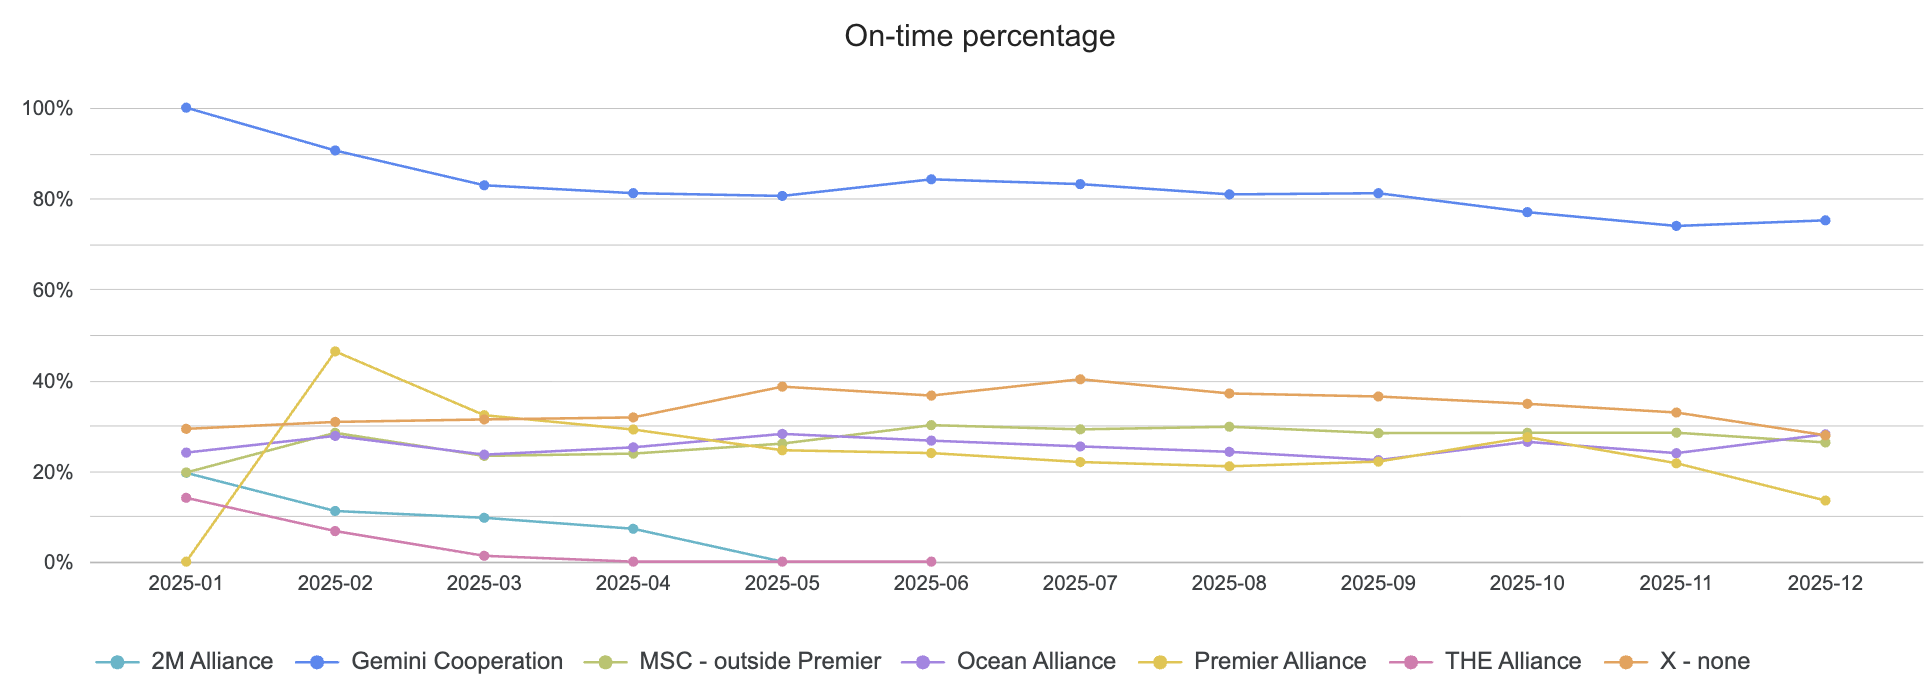
- Gemini Cooperation (81% on-time, -0.4 days delayed)
- Non-alliance (34% on-time, -3.7 days delayed)
- MSC – outside Premier (27% on-time, -4.0 days delayed)
- Premier Alliance (26% on-time, -4.3 days delayed)
- OCEAN Alliance (26% on-time, -4.0 days delayed)
It is an understatement to simply say that Gemini Cooperation is in first place when it continues to operate in a league of its own. Fewer port calls, the use of vertically integrated terminals, a vast shuttle system, and market share emphasis on North America are acutely strategic decisions that position their daily operations for success.
Gemini’s 12% decline in on-time arrivals against Q1 demonstrated the expected erosion that came with schedule maturity, as well as pockets of negative factors like Northern Europe port congestion. While the Gemini promise of a 90% rate of on-time arrival across all corridors has proven idealistic in this environment, their seamless strategies have delivered outstanding resilience.
A unique strength that gets less fanfare than on-time percentage is their commitment to an absolute minimum of blank sailings. Partners Maersk and Hapag-Lloyd announced just 18 blank sailings in 2025. This includes just 2 on Far East – North America, and 9 on Far East – Europe that were exclusive to Chinese Golden Week. For comparison, Premier Alliance lies in a similar range of just above 1 million TEU of offered global capacity and announced 84 blanks on Far East – North America, and 181 globally.
.
Monthly On-Time Arrivals by Alliance, 2025
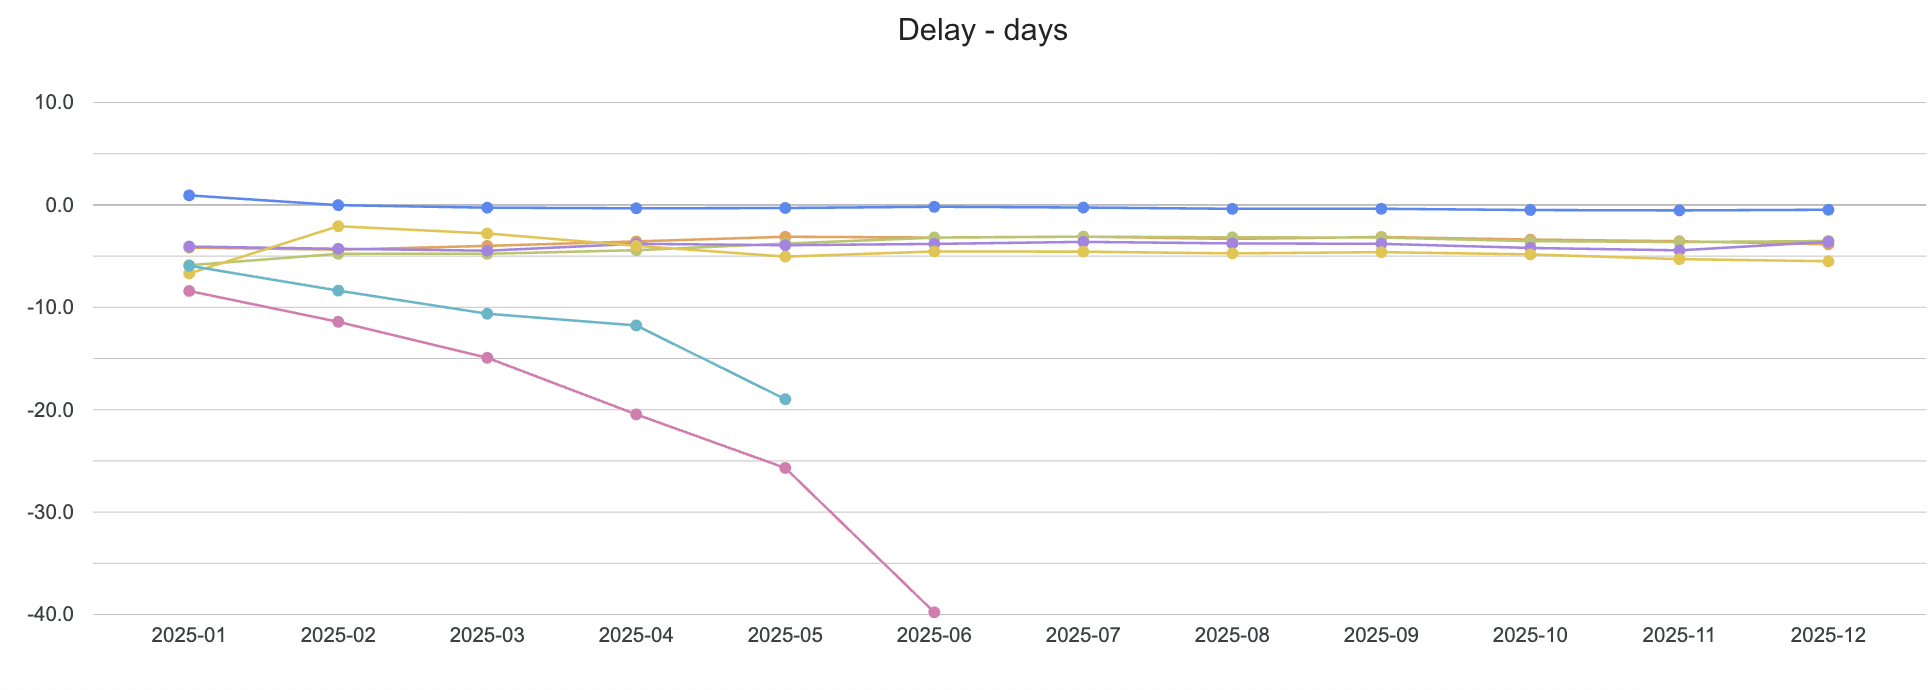
Monthly Delays by Alliance, 2025
As for our standard metrics, Premier Alliance barely edged ahead of Ocean Alliance for second-to-last place – scraping by on 0.3 less days of delay. In Q1 we saw Premier make heavy use of strategically blanked sailings and repeatedly delayed commencement dates. This was an attempt to get ahead of the extreme delays inherited from its predecessor THE Alliance, which closed 2024 at 22% on-time. These schedule manipulations proved unsustainable, illustrated by a short-lived bump of 36% in Q1 that fell by 42% of on-time arrivals, landing at 21% on-time in Q4.
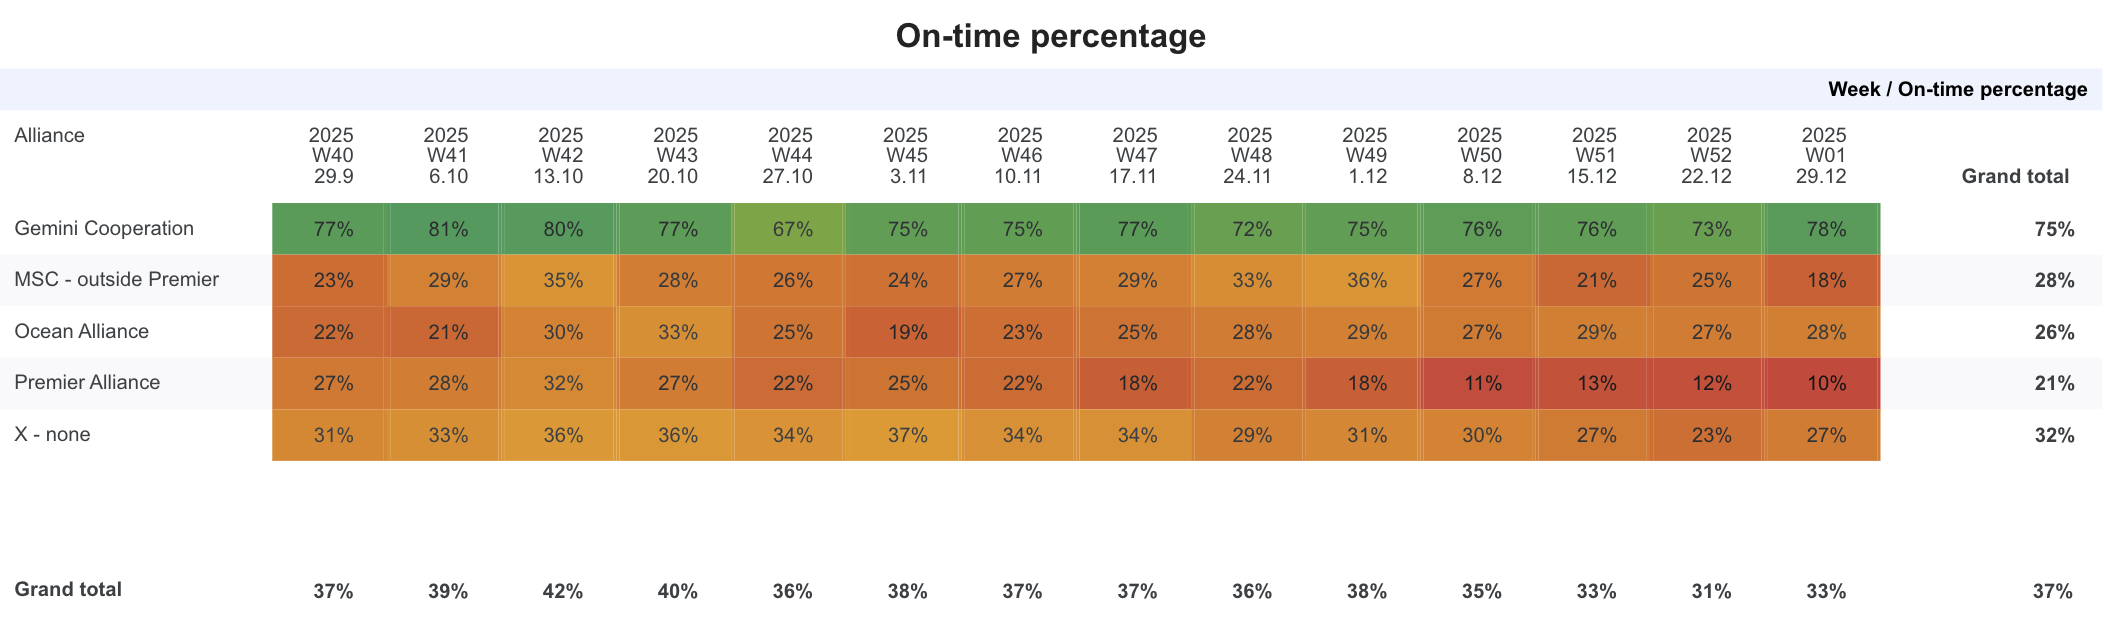
Weekly data also reveals the alliance frequently hit below 20% on-time throughout the year. In the final weeks of 2025, Premier partners saw their worst reliability yet at just 11-13% on-time. It is also worth exploring how their concentration of capacity in Asia – Europe only served to compound the existing struggles.
While Premier Alliance includes 10 strings on Far East – North America in their product, their 8 services on Far East – Europe necessitate a higher share of available capacity. These services host vessels in the 17,000 TEU range vs 10,500 TEU on their Far East – North America counterparts. Add to this an average of 17 vessel slots and 14 calls per string, strong storms and tides off the southern coast of Africa, Northern European port congestion, and Suez Canal uncertainties. This is a perfect demonstration of hyper-extended network connectivity and capacity concentration exacerbating external reliability issues.
Weekly On-Time Arrivals by Alliance, Q4 2025
Ocean Alliance has held a place in the bottom two throughout 2025, with no hint of recovery since a slow and steady decline that kicked off in Q3 2023. The partnership has fallen from 50% to 26% of on-time arrivals since 2023. Pockets of improvement granted to peers by hard schedule resets, or the relative stability offered by a trade like Europe – North America, were notably absent from their strategic roster these past 12 months.
In a positive development, MSC pulled ahead of both Premier and Ocean Alliance, reflecting a 17% improvement in on-time arrivals against their own Q1 averages. It’s possible that their post-2M emphasis on independent network expansion, as opposed to diversified partnerships, has yielded smoother daily operations and improved schedule communications by the carrier.
Quarterly On-Time Arrivals by Alliance, 2020-2025
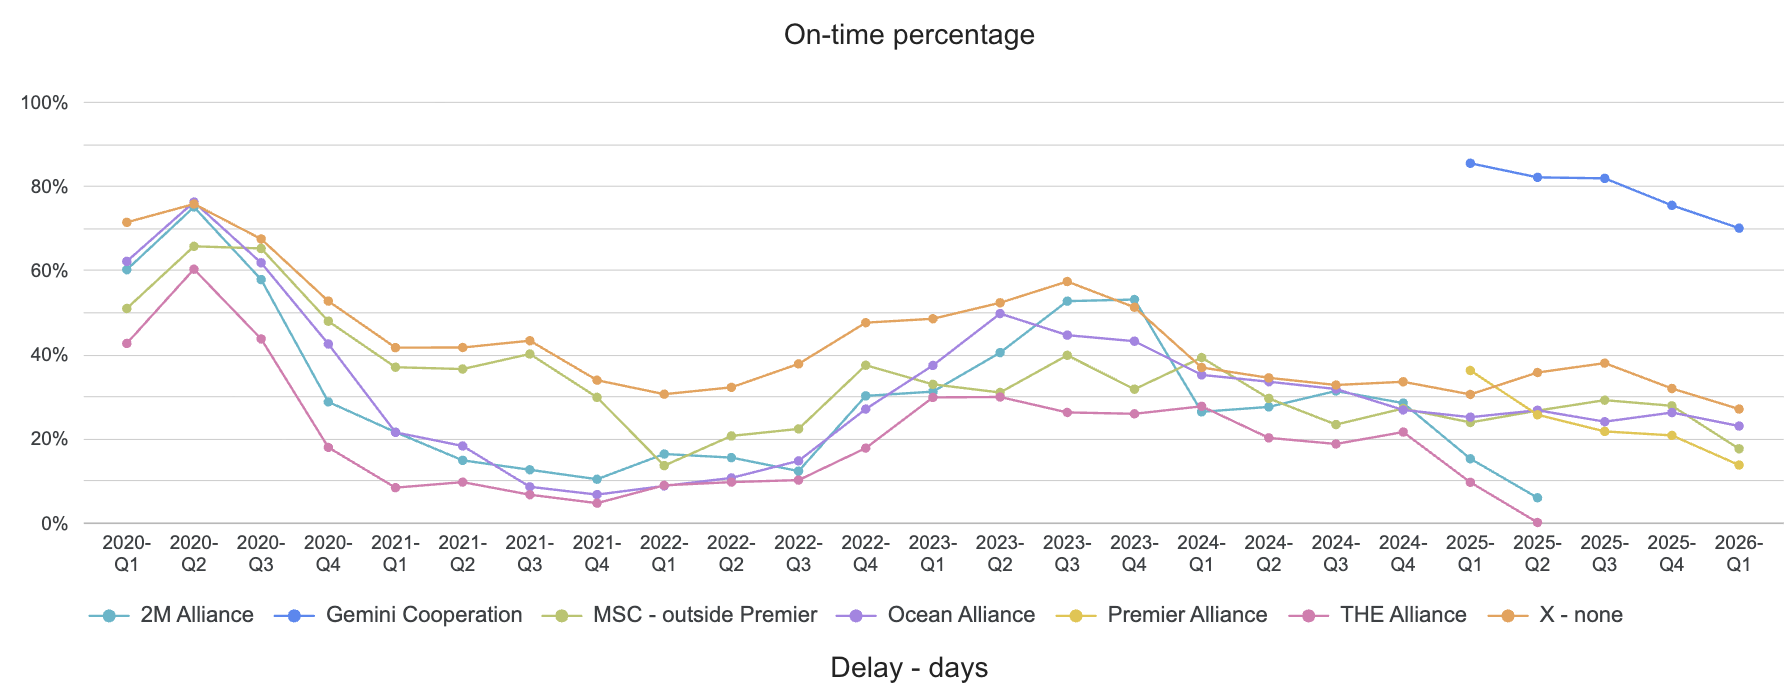
Non-alliance services came in second in the rankings, and the most accurately representative of our global average reliability at 34% on-time. This group is historically resilient and consistently outperformed traditional alliances before the introduction of the Gemini Cooperation. Non-alliance services ranked first place every quarter for three years running until Q4 2023 when they were briefly outperformed by MSC.
A moment for methodology. If you are wondering why MSC is treated as an alliance, excluding participation in select Premier Alliance strings, it’s because of the sheer scope of their global network. For perspective, they hold 26% of the current global market share into East Coast North America and boast the largest global fleet of 924 vessels at 6.9 million TEU. Non-alliance services are also treated as an alliance group in our reports in order to benchmark the performance of more fluid vessel sharing agreements.
Alliances by Best and Worst Trades
For a final bit of discovery, we took a look at what alliance performance across their best and worst trades of 2025 might reveal.
1. Gemini Cooperation
- BEST Europe - North America (87% on-time, -0.5 days)
- WORST Far East – Europe (68% on-time, -1.1 days)
Gemini Cooperation saw their worst performance in Far East – Europe, which is little surprise given it was responsible for driving down the alliance’s average global performance each month. Gemini's ‘worst’ still outperformed any other competitor’s best; with 19% more on-time arrivals than non-alliance services on West Coast South America.
2. Non-alliance
- BEST South America West Coast (57% on-time, -1.7 days)
- WORST Far East – Europe (25% on-time, -6.8 days)
Non-alliance services saw Far East – Middle East (25% on-time, -4.2 days delayed) as a close second to their worst performance in Far East – Europe. These services also happen to dominate the Far East – Middle East; meaning poor performance on this trade was based on a large sample size, unlike Premier. Out of 63 total services on Far East - Middle East, Gemini operates just 1 and Ocean Alliance operates 3, the rest being non-alliance strings.
3. MSC – outside Premier
- BEST Europe - Middle East (36% on-time, -3.5 days)
- WORST Far East – Middle East (3% on-time, -9.4 days)
MSC performed its best in Europe – Middle East and Europe – North America (33% on-time, -2.5 days delayed). These are both lanes where the carrier primarily competes against Gemini and non-alliance services for market share and has the advantage of home base. The fact that both of MSC’s best and worst trades include the Middle East suggest that their reliability issues are more closely linked to their operations at Asian ports.
4. Premier Alliance
- BEST Pendulum Services (31% on-time, -3.8 days)
- WORST Far East – Middle East (11% on-time, -6.0 days)
Premier Alliance saw even more extreme performance decline on Far East – Middle East than Far East – Europe (15% on-time, -6.8 days delay). As we highlighted in our recent review of trades, sample size plays a key role here. Premier hosted just 260 port calls throughout 2025 on this trade across the lonely AG1 string, which was eventually suspended in September.
5. OCEAN Alliance
- BEST Far East - North America (32% on-time, -3.3 days)
- WORST Far East – Middle East (11% on-time, -5.3 days)
Ocean Alliance rounds out the trend of Far East - Middle East as a tricky trade. The notable absence of Ocean Alliance services in the Europe - Middle East and Pendulum categories render this the smallest pool of comparison for an alliance. Technically, their worst performance was in Europe - North America (8% on-time, -9.8 days delayed) but given that they pulled all remaining transatlantic offerings off the table by the end of March, this wasn't counted.
Up next we dive into carrier rankings, how partners Hapag-Lloyd and Maersk measure up against each other, and if carrier performances in 2025 might yield clues to who is best equipped to navigate turbulence of a Red Sea return. If you’d like to read our past reliability reports, please visit our SRS publications page. To learn more about how Xeneta data can help you improve the resilience of your supply chain, reach out to us at contact@xeneta.com.
.png?width=387&name=freight-ship-reliability%20(1).png)
.jpg?width=387&name=ocean-freight-shipping-reliability-scorecard--feb-26%20(1).jpg)
