
Rewarding a lower CO2 emitting carrier with cargo allotments has never been easier for global shippers. Every couple of weeks, we will release the period's top and bottom performing carriers per major trade lane, as per the Xeneta and Marine Benchmark, Carbon Emissions Index (CEI). This week we're focusing on Far East - S. America East Coast. Let's go.
Q4'22 CEI Carrier Ranking
Far East - S. America East Coast
|
RANKING |
CARRIER |
CEI SCORE |
| 1 | Hamburg Süd | 76.2 |
| 2 | ONE | 82.2 |
| 3 | Hapag Lloyd | 84.3 |
| 11 | Evergreen | 109.7 |
The CO2 emitted per ton of cargo transported between the Far East and the South American East Coast rose by 6.3% in Q4 2022 compared to the quarter before. This resulted in a CEI reading of 96.6.
96.6 is the highest CEI on this trade since Q3 2021 and is the highest of the five trades out of the Far East currently covered by the CEI.
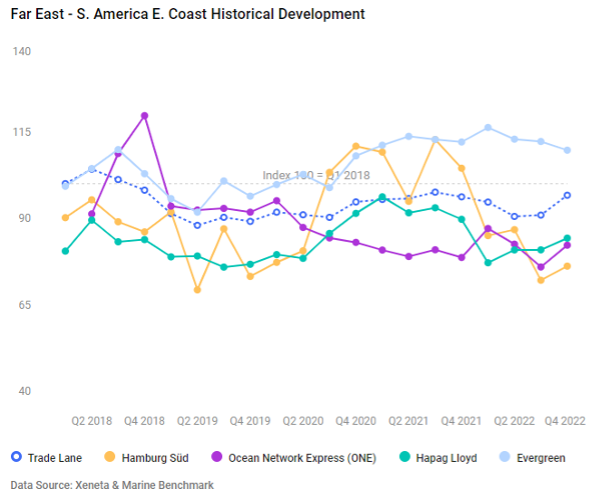
The best-performing carrier from the Far East to the South American East Coast in Q4 2022 is Hamburg Süd, with a CEI score of 76.2. This means a ton of cargo sailing on a ship operated by Hamburg Süd emitted 21% less CO2 than the average ton on this trade. Congrats, Hamburg Süd!
Hamburg Süd’s lower CEI score was due to the sailing of bigger-than-average ships on this trade, which also steamed at a slower speed than the average. These two better-than-average variables made up for Hamburg Süd’s lower filling factor than the trade lane average.
The other top-performing carriers in Q4 2022 on this trade were ONE (82.2) and Hapag Lloyd (84.3).
None of these top performers in Q4 have outperformed the trade lane average in every quarter since Q1 2018. Yet, on average, Hapag Lloyd has been the most carbon-efficient carrier in the past five years on this trade.
Among the top six carriers, the worst performer on this trade in Q4 2022 was Evergreen, as per CEI data.
Between the Far East and the South American East Coast, Evergreen clocked in a CEI of 109.7. This is one of three CEI-measured trades where Evergreen’s carbon efficiency is worse than the trade lane average.
Though Evergreen was the carrier with the highest filling factor between the Far East and the South American East Coast in Q4, it sailed on smaller, and therefore less carbon efficient, ships (-9.5% than trade lane average) and sailed much faster (+8.9%).
No correlation between greener carrier & higher container rates
When comparing the CEI and Xeneta’s container rates in Q4, it becomes clear that choosing a (relatively) greener carrier does not necessarily lead to higher costs.
On the spot market, Hapag Lloyd’s average rates are lower than the market average. On the long-term contract market, Hamburg Süd’s average long-term rate is also lower than the market average when looking at all valid long-term contracts.
Compared to the market average, Evergreen is more expensive on the long-term contract market but also offers savings on the spot market compared to the market average.
Get an honest view of carrier emissions
CEI data powered by Xeneta and Marine Benchmark makes no assumptions and is independent from carriers. It's sourced from AIS tracking of actual sailings, currently covering 13 of the world’s biggest trades, with more being added in the coming months. Find out how you can factor sustainability into your carrier selection here.
Note:
The 'Weekly Container Rates Update' blog analysis is derived directly from the Xeneta platform. In some instances, it may diverge from the public rates available on the XSI ®-C (Xeneta Shipping Index by Compass, xsi.xeneta.com. Both indices are based on the same Xeneta data set and data quality procedures; however, they differ in their aggregation methodologies.
Want to learn more?
Sign up today for our upcoming monthly State of the Market Webinar to stay on top of the latest market developments and learn how changing market conditions might affect your contract negotiations.
PS: Missed the LIVE session? Sign up to get the full webinar recording.