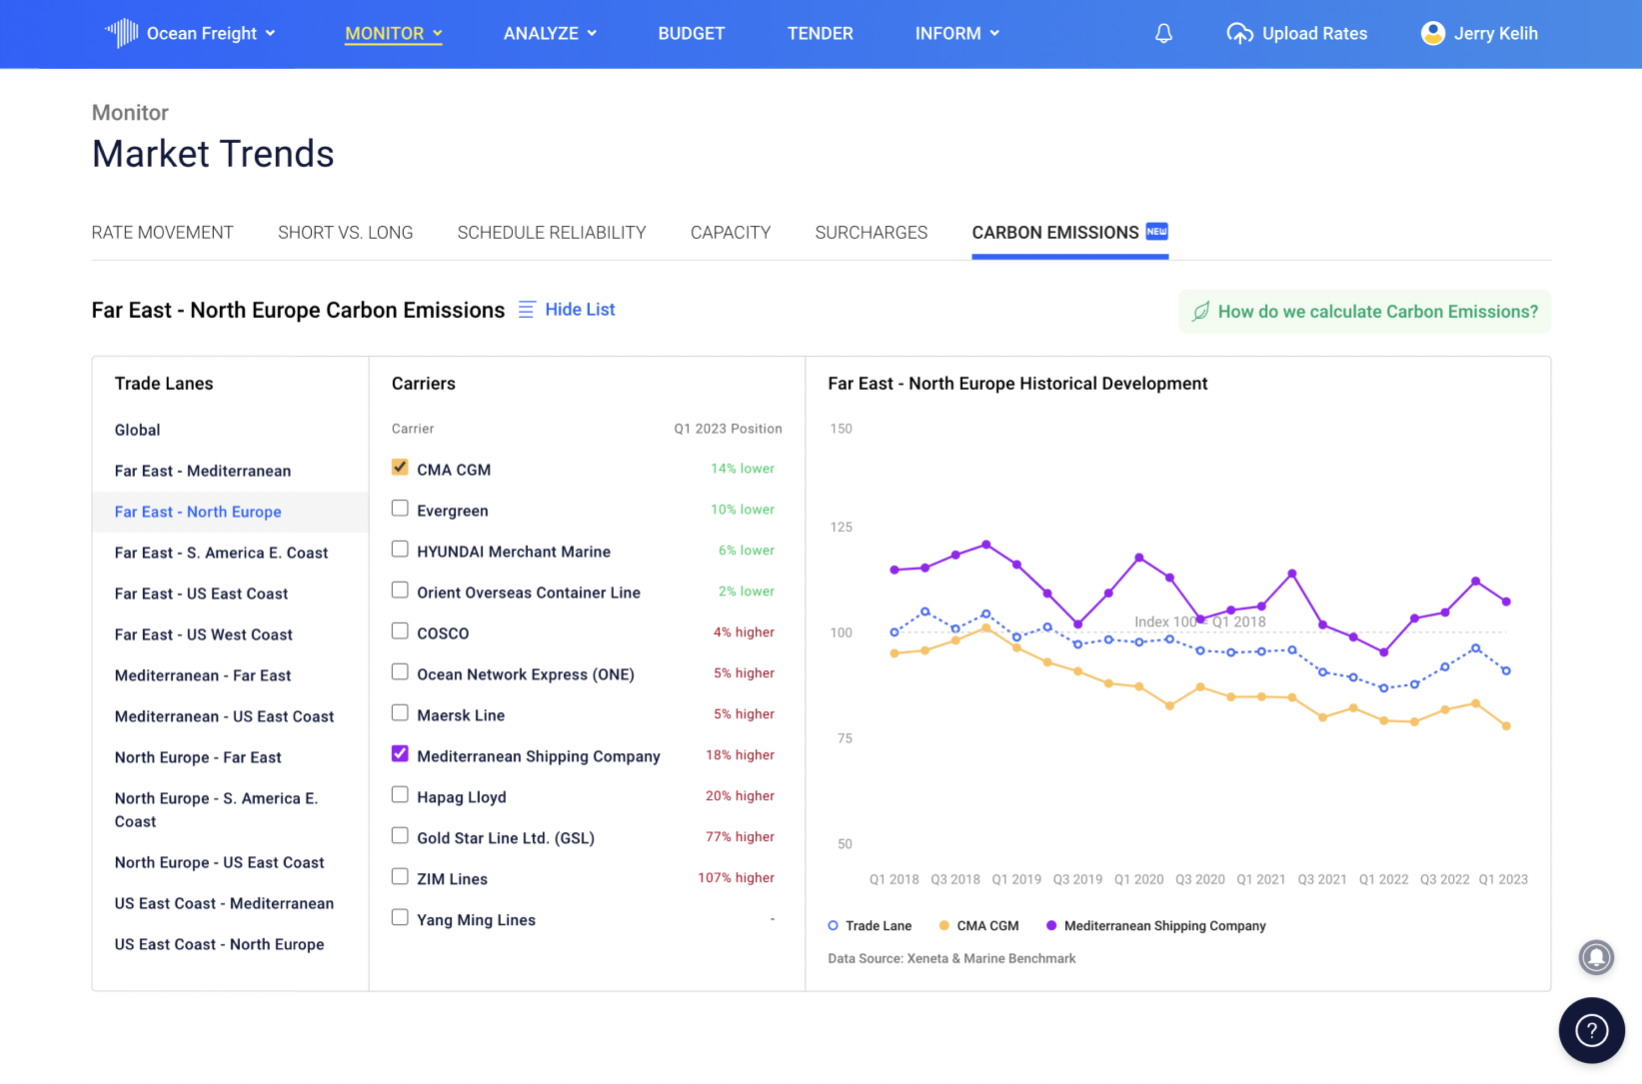
Carbon Emissions Index
You want to make a more positive impact on the planet—we want to help.
Lead the way towards a more sustainable supply chain
In partnership with Marine Benchmark, the Carbon Emissions Index (CEI) is a first-of-its-kind data solution, showing you the carbon intensity of the world's leading carriers across 48 main global trade lanes.
Based on actual cargo load from real sailings, this is the only accurate picture of carrier emissions on the market.

Make the planet a bit greener and your ESG goals a lot stronger
Get an honest view of carrier emissions
CEI data makes no assumptions — all data is independent from carriers and is sourced through AIS tracking of actual sailings, allowing you to make decisions based on unbiased facts.

Ahead of the Game
Quarterly updates on the four-year historical view provide an inside view on how carriers' carbon intensity is evolving in close to real-time
Factor sustainability into your carrier selection
Tackle your ESG goals head-on by choosing the carrier and/or trade lane that will have the smallest impact on the planet, but the biggest impact on your bottom line.
What's behind the CEI data?
How did we manage to develop the only factual, timely and independent (zero input from carriers) reference on carrier emissions?

Ready to see Xeneta and the CEI in action?
It's time to modernize the way you buy & sell freight. Witness the power of carbon emissions and freight rate data in a custom demo.
Get a live demo based on actual cargo load with all data sourced through AIS tracking of actual sailings, providing you with the market's only accurate picture of carrier emissions.

.png)


