
Records have been tumbling on the Carbon Emissions Index as performance improves across the world’s major ocean freight shipping trades – but which carrier takes top spot?
Firstly, the Far East to US West Coast trade fell to 70.5 points in Q4, not only the lowest recorded on this trade since the CEI began in Q1 2018, but also the lowest ever recorded across the top 13 trades covered by the CEI.The CEI is based on average CO2 emissions per ton of cargo carried, with the baseline set in Q1 2018. Any reading below 100 therefore indicates an improvement in carbon efficiency over the past five years.
Two other trades saw their CEI rating hit record lows in Q4, namely the Far East to Mediterranean and Far East to US East Coast, with 86.3 points and 74.5 points respectively.
Of Xeneta’s 13 top trades, eight posted lower emissions in Q4 2023 than the baseline in Q1 2018.
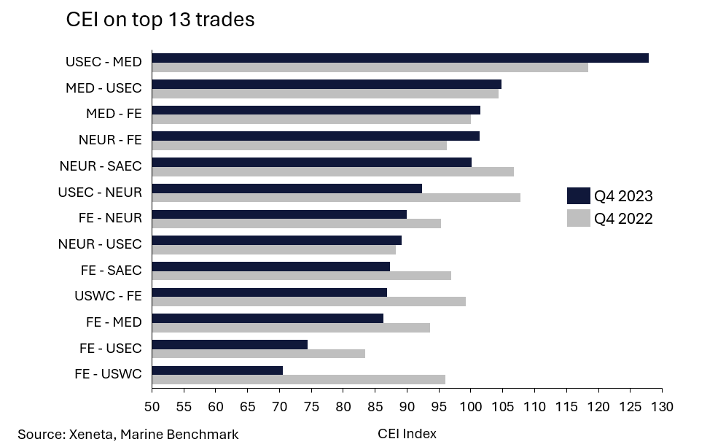
That leaves five trades which posted higher CO2 emissions per ton of cargo carried in Q4 2023 compared to Q1 2018. Three of these are backhaul trades from US East Coast to Mediterranean, which posted the biggest increase in emissions compared to Q1 2018, as well as the Mediterranean to US East Coast and North Europe to South American East Coast.
Red Sea crisis yet to impact the CEI
The crisis in the Red Sea, which began in the middle of December, is yet to be reflected in CEI data. The CEI is based on completed voyages and as the first ships diverted around the South of Africa arrived after the end of the year, they will be included in Q1 2024 data rather than Q4.
Q1 2024 data will then reflect the longer sailing distances on many trades, as well as an increase in speed as carriers seek to address the capacity crunch caused by delays.
Data already received from Marine Benchmark shows an increase in sailing speed of container ships. Perhaps unsurprisingly, the biggest increase in sailing speed recorded in January has been seen in the largest container ships. Ships over 13 500 TEU have sailed at an average speed of 16.0 knots so far in January, the highest speed since mid-2021 and 11.9% faster than a year ago.
Best performing trades
As well as being the trade with the biggest CEI improvement compared to Q1 2018, the Far East to US West Coast can pride itself on being the trade with the largest year-on-year and quarter-on-quarter reduction in CO2 emissions per ton of cargo carried in Q4 2023. Compared to a year ago, its CEI score has improved by 26.5%. Assuming a container carries 10 tons, this equates to an average saving of 0.18 tons of CO2 per container.
A big factor in the reduction of carbon intensity on this trade is an increase in the average size of ships deployed, which has risen by 25% from 8 000 TEU in Q4 2022 to 10 000 TEU in Q4 2023. While larger ships also emit more CO2, on a per tonne of cargo carried, emissions reduce (assuming the cargo load rises to match the increase in ship size).
In fact, the filling factor between the Far East and the US West Coast has seen the biggest year-on-year increase across Xeneta’s top 13 trades. In Q4 2023 it was up 7 percentage points from a year ago as demand ramped up and carriers refrained from adding capacity.
The Far East to US East Coast trade took the second spot on the CEI with a score of 74.5 points.
The trades from the Far East to the US West and East coasts took the top two positions on the CEI despite them both also having the highest sailing speeds out of the top 13 trades on the index.
Sailing speeds on these trades did slow down in Q4 however, with sailings into the US West Coast falling from 16.8 knots to 16.4, while into the US East Coast the speed fell by 0.2 knots to 16.2.
These trades featuring at the top of the sailing speed ranking is nothing however, as they both also had the fastest ships back in Q1 2018 with an average of 18.1 knots into the West Coast and 17.8 into the East Coast.
Slowing ships to manage capacity
In general, a reduction in steaming speed is the most consistent change across the CEI’s top 13 trades.
Back in Q1 2018, the slowest speed was between the Mediterranean and the US East Coast, sailing at an average of 15.4 knots. No other trades were under 16 knots.
In contrast, in Q2 2023, only three trades sailed at more than 16 knots, with six of them averaging less than 15 knots. Moving on to Q4 2023, the slowest speed across the 13 trades was between North Europe and East Coast South America, where a 14.9% decrease compared to Q1 2018 brought the average speed down to 14.3 knots.
.png?width=690&height=474&name=CEI13(2).png)
Slowing ships down was a key way for carriers to manage capacity and put upward pressure on freight rates in the closing months of 2023. On some trades this added an extra week to the round trip so carriers could deploy more ships without adding more available capacity.
Another significant shift on the CEI metrics between Q1 2018 and Q4 2023 is found in the filling factor, the result of the supply and demand balance on a given trade.
There are only two trades where carriers have achieved a significant increase in the average filling factor - Far East to the US West Coast and Far East to South American East Coast, the latter of which has seen a 6 percentage point increase from Q1 2018.
In contrast, there are eight trades on which the average filling factor has fallen by 5 percentage points or more compared to Q1 2018.
The biggest drop is on the backhaul trade from the US East Coast to the Mediterranean, where carriers chose to park excess capacity (along with other trans-Atlantic trades) and the average filling factor has fallen by 18 percentage points.
Perhaps unsurprisingly, the largest drop in filling factor on the fronthaul trades is from the Mediterranean to the Far East, down by 8.3 percentage points from Q1 2018.
Lowest ranked trades on the CEI
The large drop in filling factor between the US East Coast and Mediterranean in large parts explains why this trade has the highest, and therefore worst, CEI score across the top trades. It posted a reading of 127.9 points in Q4 2023, which, while an improvement of 10.1% compared to Q3 2023, is still way above the next worst of the top 13 trades on the CEI.
The other four trades with a CEI score of over 100 in Q4 2023 have seen much smaller increases compared to Q1 2018. They range from a score of 100.1 (NEUR-SAEC) to 104.8 (MED-USEC).
Common to all these trades is that, not only are they emitting more CO2 per tonne of cargo carried than in Q1 2018, but their emissions have also increased on a year-on-year basis. Older ships being deployed to these trades as well as considerable drops in filling factors are two of the big drivers of these year-on-year increases.
2023 was the first year in which the International Maritime Organization’s (IMO) Carbon Intensity Indicator (CII) was in force, without any noticeable effect on carriers' CEI results. Partly this can be explained by the different methodologies, the CEI is based of each completed journey between two regions, while the CII is calculated based on a full year of trading. It can also be explained by the weaker market fundamentals which have led to operational choices that improve the CII score, even though the changes were made for commercial reasons.
Which carrier takes top spot on the CEI?
Eight of the top 10 carriers had the best CEI score on at least one of the top 13 trades. Yang Ming and ONE come out as the best having achieved the top spot on three trades and in the top five across all other trades on the CEI.
Of the biggest global carriers, only CMA CGM and Hapag Lloyd failed to finish in first place on any of the top 13 trades, though both appeared in the top three and top five numerous times.
.png?width=936&height=596&name=CEI13(3).png)
It should also be noted that the range in CO2 emissions per tonne of cargo by carrier vary widely across the different trades.
Trades into the South American East Coast (SAEC) had both the biggest and smallest spread between the top three carriers. From the Far East into SAEC, there was only three index points difference between Yang Ming in first place (71.3 points) and Hapag Lloyd in third place (74.3 points).
However, imports into SAEC from North Europe had the largest spread between the top three carriers, with Evergreen in first place (62.9 points) being 36 index points ahead of MSC in third place (99.1 points).
Translated into actual tons of CO2 per container, and maintaining an assumption of ten tons per container, the difference between choosing the carrier in first and third place results in a saving of 0.25 tons of CO2 per container.
Get an honest view of carrier emissions
Stay one step ahead of your competitors by making well-informed and sustainable choices when selecting shipping carriers. Xeneta and Marine Benchmark offer an independent and trustworthy Carbon Emissions Index (CEI) data, ensuring accuracy without any guesswork. By utilizing AIS tracking of real-time sailings on 48 major trade routes worldwide, with coverage expanding further in the near future, you can rely on up-to-date information. Don't settle for outdated and unreliable data. Schedule a demo of the CEI today and begin making intelligent shipping decisions.