


.png?width=1200&name=venti-views-FPKnAO-CF6M-unsplash%201%20(1).png)
Welcome to Xeneta’s Schedule Reliability Scorecard, a Year in Review. We kick off the new year with a macro look at global reliability in 2025. Each week we’ll be peeling back another layer in the story of schedule reliability and how geopolitical events large and small shape our connections to the global supply chain.
Quarterly On-Time Arrivals, 2022 - 2025
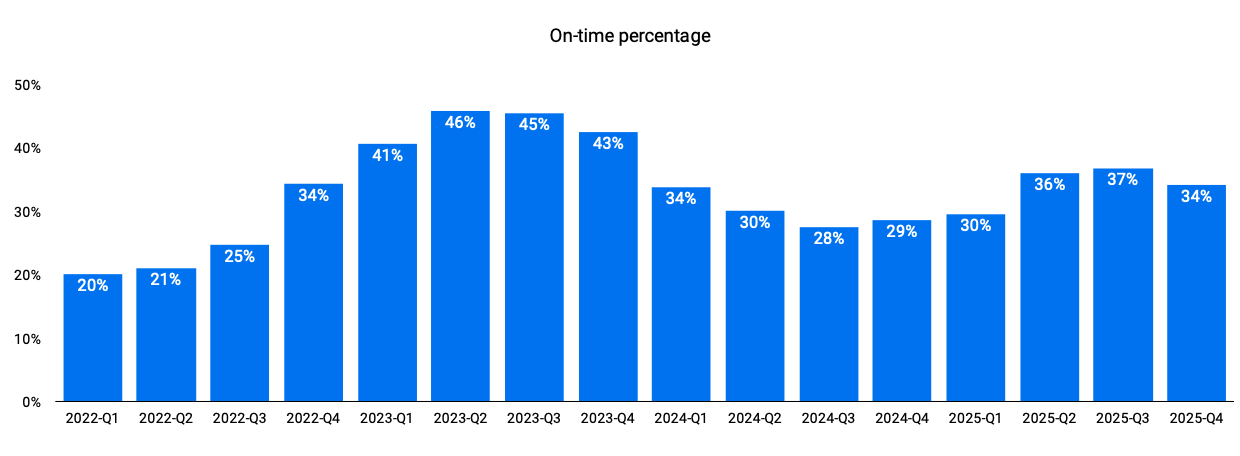
While the resting state of global reliability remained firmly below ideal these past 12 months, we did finally climb our way out of pandemic-level territory with a 13% improvement against the previous year. Arrivals in 2025 held relatively steady at an average of 34%, while 2024 closed with an average of 30% on-time. If we set aside the exceptionally poor Q1 results shaped by the final throes of 2M and THE alliances, the 2025 average rounds out a tick higher at 36%, and illustrates a more significant 20% increase in on-time arrivals against 2024.
Monthly Global On-Time Arrivals, 2024 - 2025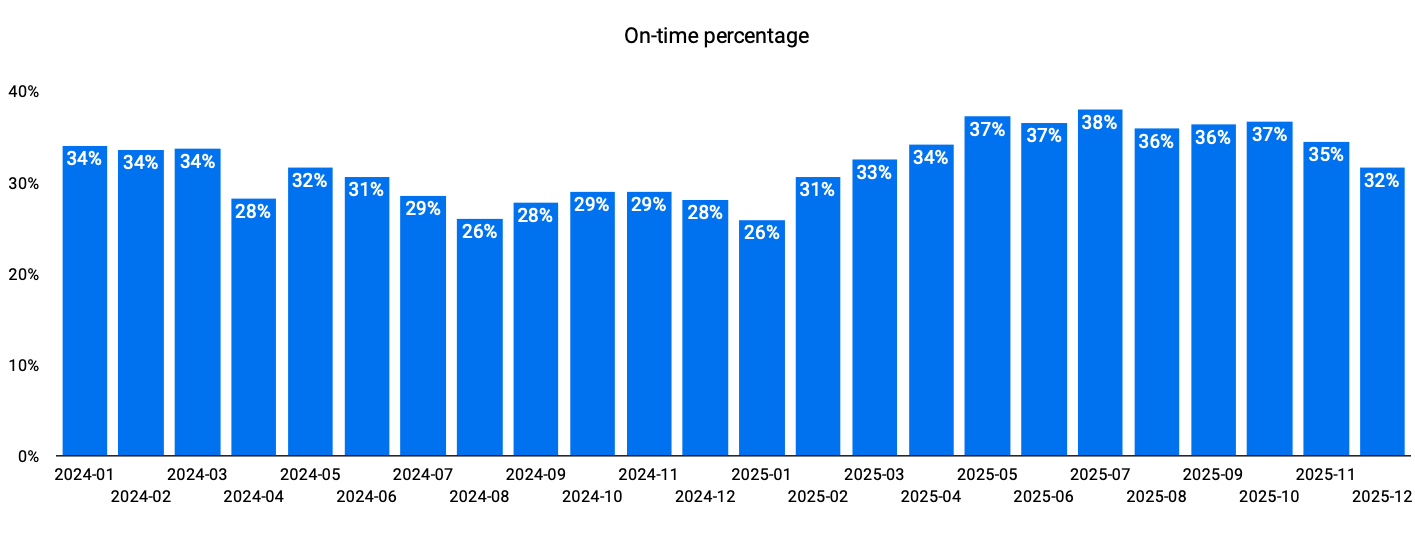
Monthly Global Delays, 2024 - 2025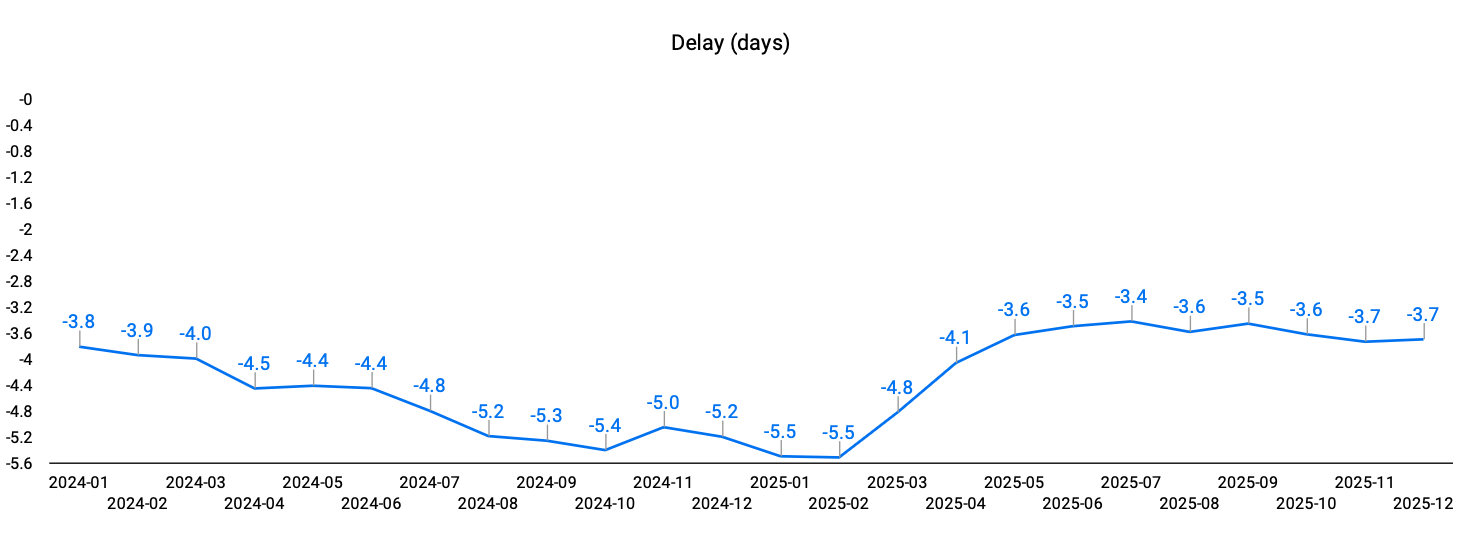
Improvements against the previous year were echoed at the scale of month-over-month fluctuations and delays. In 2024 we saw monthly reliability fluctuate by as much as 18% of on-time arrivals cut from March (34%) through April (28%) and an average of 2.5 percentage points per month. The range was a ceiling of 34% and monthly dips as low as 26% in August. Average monthly delays throughout 2024 were -4.5 days and consistently exceeded –5.0 from August through December.
Thanks to the recalibration of massive global networks, the start of 2025 looked shaky indeed, with Q1 2025 averaging at 30% on-time and -5.3 days delayed. In Q2 we saw a fast reprisal up to 36% of on-time arrivals and a 1.7 day reduction of delay, owed in no small part to a promise kept by Gemini Cooperation. The most pronounced decline this year was an 8.6% loss in on-time arrivals from November (35%) to December (32%), but that still landed softer than the MoM flux witnessed in 2024. If we exclude Q1 results as extreme outliers once again, monthly delays in 2025 more favorably clock in at –3.7 days. Broad YoY improvements aside, the more recent 13% decline in on-time arrivals since October make us wonder if the start of 2026 will see us inch closer to the 44% average of 2023, or the dismal 25% of 2022.
None of our readers are strangers to the transformative uncertainties that took center stage this year; from the on-again-off again Israel-Houthi ceasefires to Trump’s tariff wars against friendly allies and competitors alike, to European work stoppages, extreme congestion, and climate change fueled disasters. It’s hardly the first year in recent memory that’s been defined by not-so-unprecedented challenges, but what does stand out are the positive drivers that made it possible to reverse the ominous descent of 2024. In the days ahead, we dive further into how these events influenced reliability across trades, alliances, carriers, and ports.
Up next we investigate the best and worst trade performances of 2025 and how cancelled sailings help us illustrate turbulence when on-time arrivals fall short. If you’d like to read our earlier reliability updates, please visit our SRS publications page.
To learn more about how Xeneta data can help you improve the reliability of your supply chain in critical moments, reach out to us at contact@xeneta.com

