


We are back with another ranking of carrier carbon emissions based on the Xeneta and Marine Benchmark Carbon Emissions Index (CEI). We like to call it "naming and faming". This week we are taking a look at the popular Far East to North Europe.
The Xeneta and Marine Benchmark Carbon Emissions Index (CEI) from the Far East to North Europe followed the global trend upwards in Q4 2022. It rose by 4.9% from Q3 2022 to 96.3, which is the worst CEI result on this trade since Q2 2020.
Q4'22 CEI Carrier Ranking
Far East to North Europe
|
RANKING |
CARRIER |
CEI SCORE |
| 1 | Yang Ming Lines | 76.5 |
| 2 | CMA CGM | 83.2 |
| 3 | Evergreen | 86.5 |
| 10 | Hapag Lloyd | 119.3 |
The increase in the average CO2 emitted per tonne of cargo carried on this trade is largely due to carriers' inability to fill their ships as much as in previous quarters. The filling factor fell to 85.8% in Q4 2022, its lowest since Q2 2018.
The carrier with the best CEI result in Q4 2022 between the Far East and North Europe was Yang Ming, scoring 76.5.
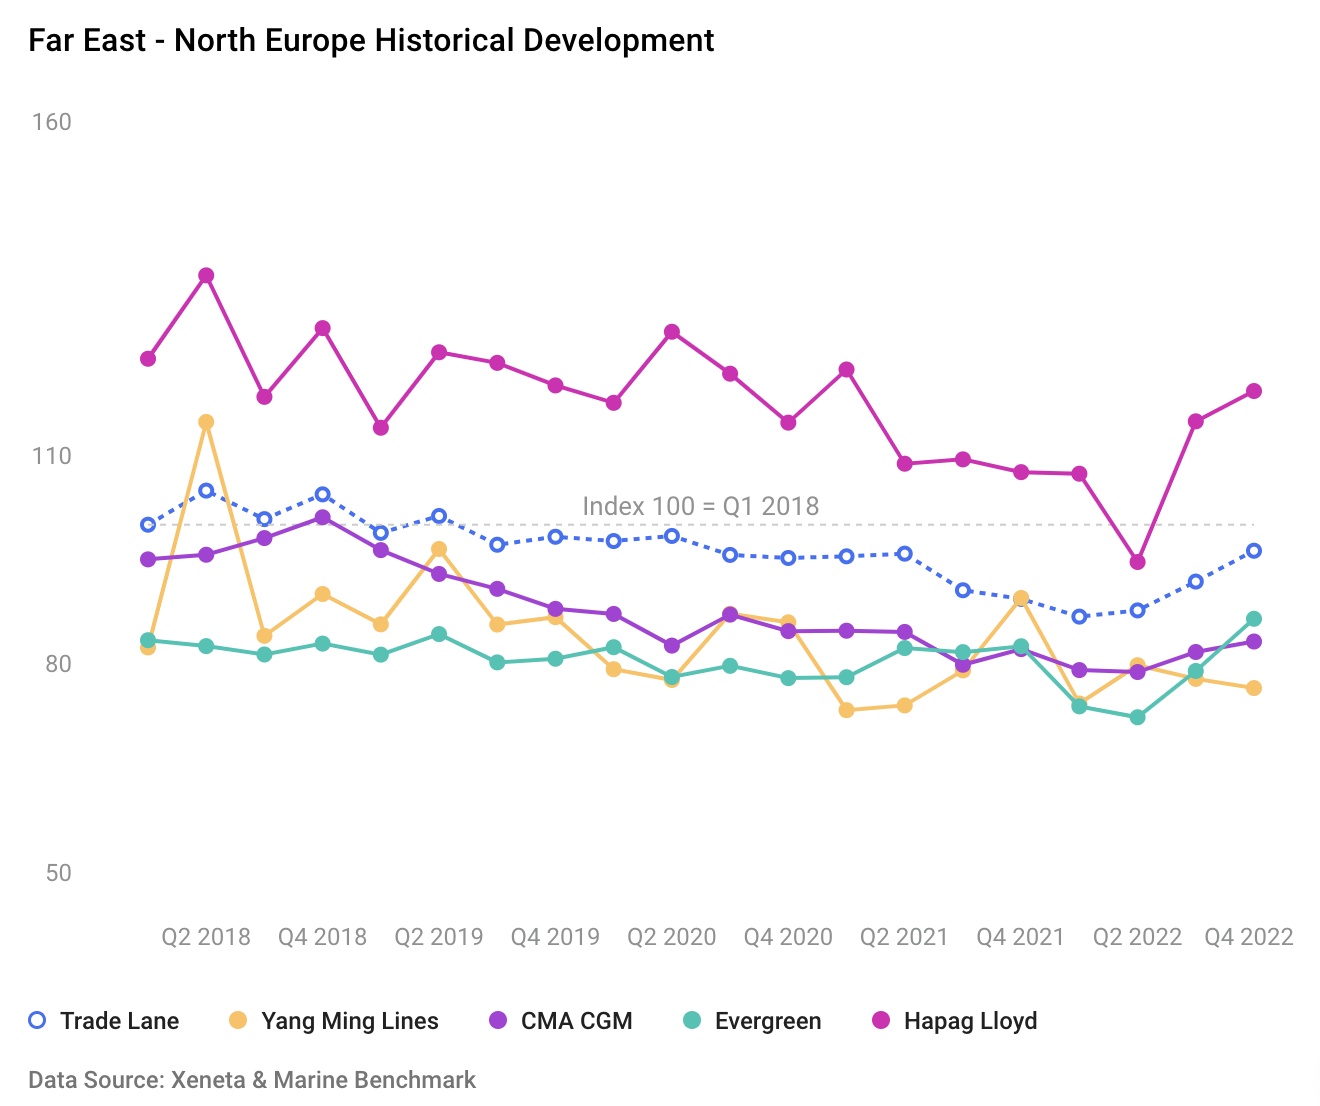
Yang Ming outperformed the average across all carriers by 10.8% and was more than twice as carbon efficient as the worst-performing carrier on this trade.
Yang Ming saw a much smaller drop in its filling factor than the average across the trade and also increased the average size of the ships it deployed on this trade. Despite this, Yang Ming's CEI still increased by 4.8% from Q3 2022, partly due to an increase in the average speed.
Get an honest view of carrier emissions
CEI data powered by Xeneta and Marine Benchmark makes no assumptions and is independent from carriers. It's sourced from AIS tracking of actual sailings, currently covering 13 of the world’s biggest trades, with more being added in the coming months. Find out how you can factor sustainability into your carrier selection and get a demo of the CEI here.

