
The one-sided volatility in spot rates is currently evident on all trades, yet the difference in altitude is astonishing.
With only two trades falling by a single-digit percentage, other trades have experienced a 30% fall in spot rates from just three months ago, during the usual peak season month. There is a clear indication that the cost of shipping containerized goods out of the Far East have fallen the most.
Spot & Long Term Rate Changes On Selected Trades
The buzz surrounding the deteriorating Transpacific head haul from the Far East to the US West Coast now seems well earned, as the spot rates have been sitting below USD 3 000 per TEU since early October after falling by 60% from early July levels.
While the drop in spot rates is substantial, the trend is less clear amongst the long-term contract rates on the same trades out of the Far East.
Long-term rates have marginally increased on the trade lanes into the US since July, while the inbound trade lanes for the Mediterranean and North Europe have seen a decline of 14% and 30%, respectively.
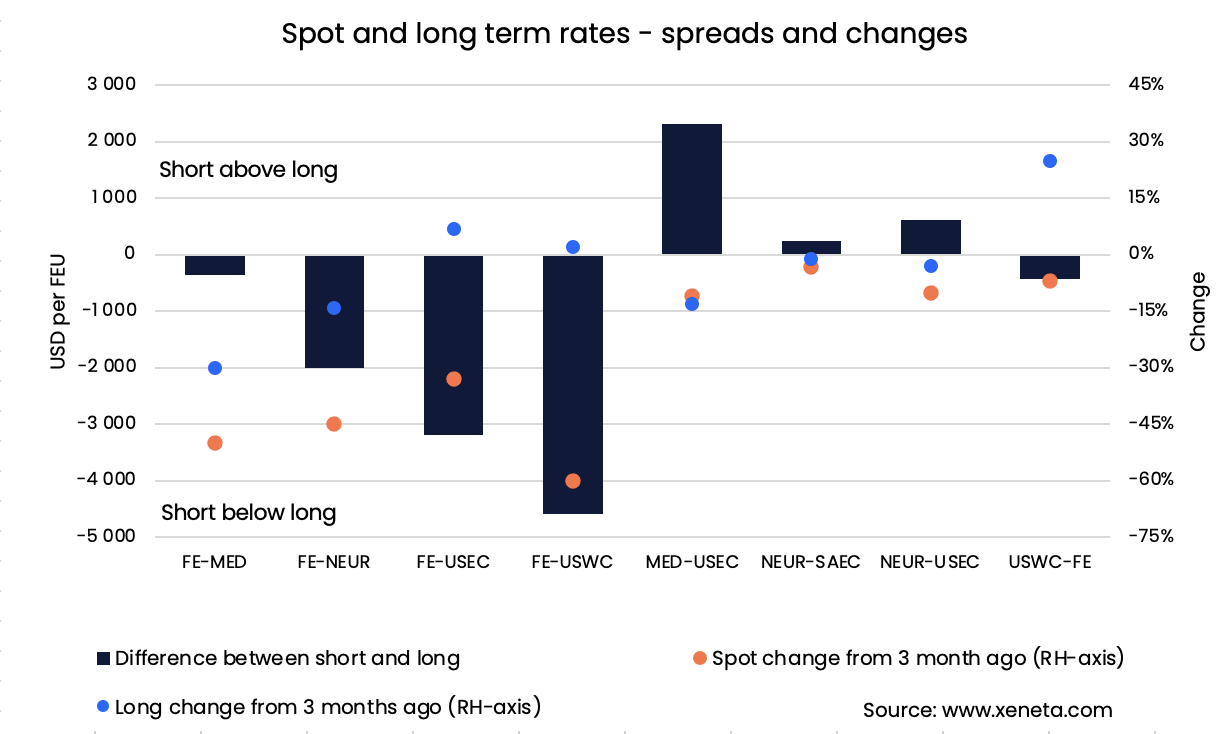
The short and long-term rates from the Far East to the Mediterranean are close to one another as opposed to the three other trades out of Asia.
The long-term rates into the US West Coast are right around where the spot market was three months ago, witnessing a spread of USD 4 600 per FEU by October 11.
Opposite to the Transpacific trend, the trade lane from the Mediterranean to the congestion-marred US East Coast shows a spot market that still sits more than USD 2 000 per FEU above the contract rates.
As rates on the trade also lost altitude in October, its simultaneous nature has resulted in a roughly unchanged spread.
Note:
The 'Weekly Container Rates Update' blog analysis is derived directly from the Xeneta platform, and in some instances, it may diverge from the public rates available on the XSI ®-C (Xeneta Shipping Index by Compass, xsi.xeneta.com. Both indices are based on the same Xeneta data set and data quality procedures; however, they differ in their aggregation methodologies.
Want to learn more?
The container market is no walk in the park. You need to have the latest rate and supply data to be able to plan and execute your freight procurement strategy quickly. Xeneta's real-time and on-demand data is here to help you answer, "Am I paying the right freight rate to get my cargo where it needs to be?"
Sign up for our weekly 15-minute live group demo below and see Xeneta for yourself.