Container shipping demand from China to Mexico increased by a massive 59.7% in January 2024 compared to January 2023.
Rising from 73,000 TEU to 117,000 TEU (source: Container Trades Statistics), this is probably the strongest growing trade in the world right now.
The strength in trade between China and Mexico has been building, with the annual growth rate in 2023 standing at 34.8% compared to just 3.5% in 2022.
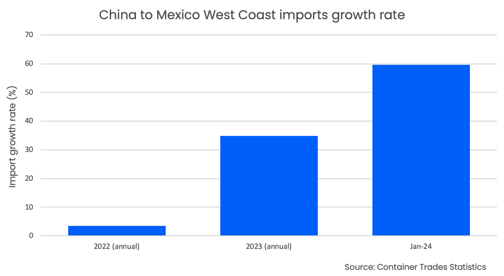
This growth saw Mexico leapfrog China in Q1 2023 to become the number one trading partner for imports into the US measured by value (source: US Census).
However, with a sizeable portion of these goods likely being trucked into the US, it gives rise to the possibility that China’s increase in trade with Mexico is being used to circumvent tariffs placed on imports from China to the US as part of the ongoing trade war.
Alternative routes into US must be considered
At last week’s TPM24 in Long Beach, California, focus for discussion fell on the main trades from Asia to Europe as well as the Transatlantic and Transpacific. This included a presentation and panel discussion on stage with Xeneta Chief Analyst Peter Sand who provided delegates with in-depth insight on the impact of conflict in the Red Sea on these markets.
While these major trades will always demand attention, it is important to consider alternative Transpacific routing into the US via Mexico from China, and Asia more generally, due to the current geo-political climate.
In January 2024, the China to US West Coast trade lane was nine times bigger than China to Mexico. Back in January 2023 it was 11 times bigger. The difference in the scale of imports on these trades must not be ignored, but the growth rates suggest a shift is occurring.
To illustrate the rate of this shift, in a purely hypothetical scenario where the growth rates in January 2024 for China to US West Coast (+17.1%) and China to Mexico (+59.7%) are fixed going forward, then by the year 2031 more containers will move between China and Mexico than between China and the US West Coast.
Note: Mexican imports arrive via its east coast ports (Altamira and Veracruz) and its main west coast ports (Manzanillo and Lázaro Cárdenas). This update focuses the connection to US West Coast imports and therefore focuses on the China to Mexico West Coast trade only.
A hugely complex market for shippers
While most major trades have experienced spot market volatility over the past year, China to Mexico West Coast has been of particular concern for shippers. From the low of USD 1351 per FEU at the end of January 2023, the average spot rates on this trade increased to USD 3062 per FEU just over three months later in early April.
In comparison, the spread between the average low and average peak on the spot market during 2023 was less from China to the US West Coast, increasing from USD 1203 per FEU to USD 2131 in under five months.
To highlight the complexity in decision-making for shippers, 2024 has seen a reversal of these patterns.
As illustrated in the graph, spot rates for Chinese exports into the US West Coast all but touched USD 5000 per FEU in February while rates from China into Mexico peaked earlier in January and at a much lower level.
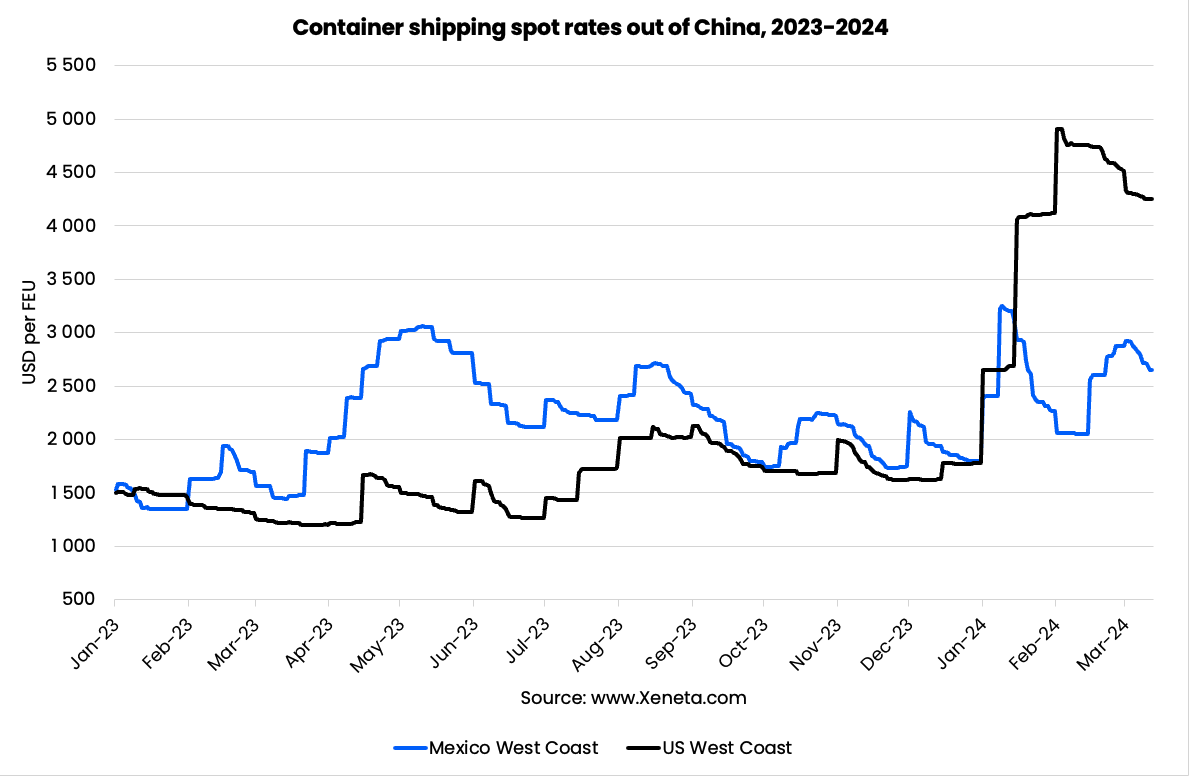
Spot markets lead a merry dance
Data on the Xeneta platform shows average spot market rates from China to Mexico have consistently exceeded long term contract market rates since April 2023. However, the trade into the US West Coast has been more volatile, flip-flopping between the spot and long term markets having the highest rates.
That is until the start of 2024 when spot rates went vertical in the aftermath of the Red Sea crisis, increasing by 175% in two months.
Average spot rates into Mexico West Coast and US West Coast ended 2023 at the same level – USD 1971 per FEU – before diverging significantly. Average spot market rates from China into the Mexico West Coast declined by 36.7 during January while rates into US West Coast increased by 84.8%.
During February, rates converged again, with the average spot rate into the US West Coast falling by USD 386 per FEU (-8%) while rates into the Mexico West Coast increased by USD 820 per FEU (40%).
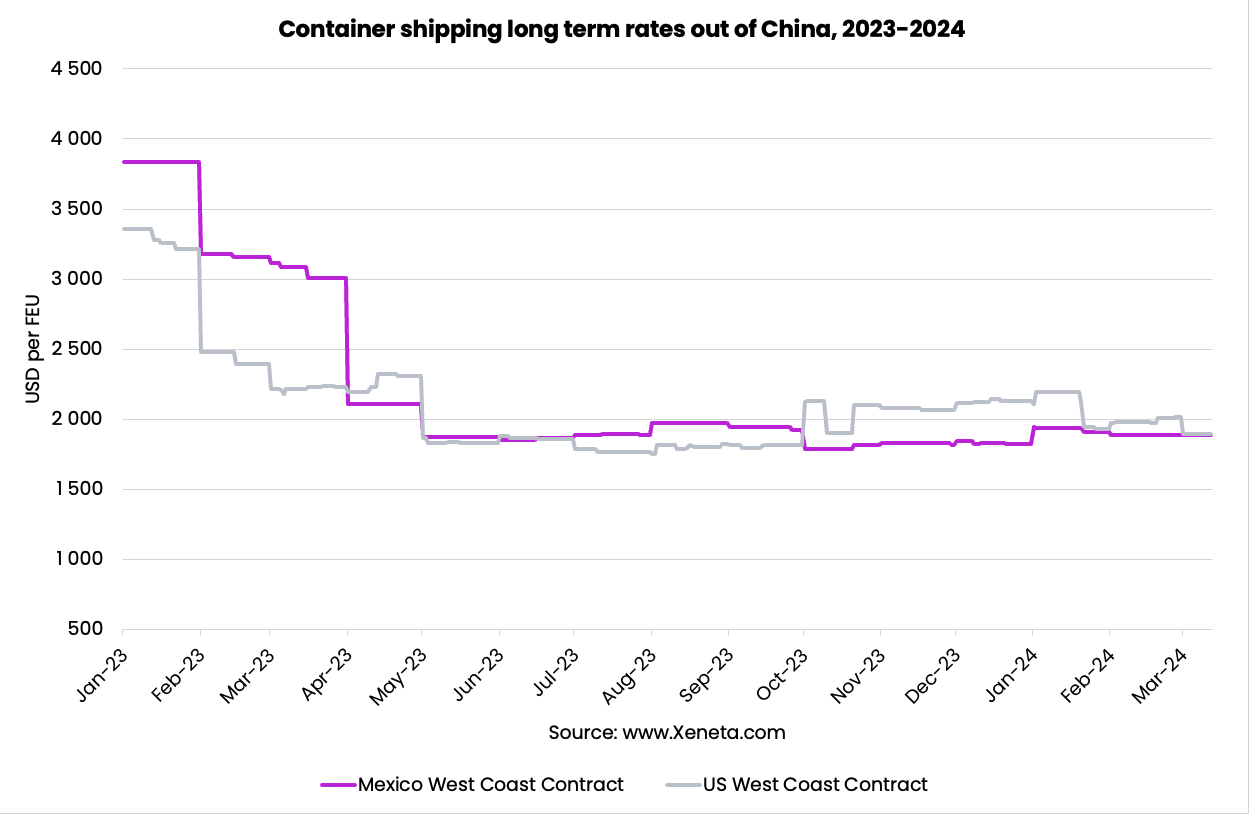
Long term markets are also complex
In July 2023, long terms rates for container shipping from China to Mexico West Coast moved higher than long term rates to the US West Coast, at USD 1890 per FEU and USD 1790 per FEU respectively.
This remained the case until October 2023 when long term rates into the US West Coast once again become the more expensive at USD 2130 per FEU compared to USD 1790 per FEU into the Mexico East Coast.
Again, this hierarchy remained in place until March 2024 when both trades converged almost exactly to stand at USD 1887 per FEU into Mexico West Coast and USD 1892 per FEU into the US West Coast.
This is a prime example of how the ‘best option’ for shippers is likely to change over time as the market develops and why it is so important to not only look at individual trades but also benchmark them against viable alternative import routes.