
The balance between capacity and demand is the at the heart of the ocean freight shipping market and nowhere is this relationship more important than on trades out of the Far East.
Firstly, let’s look at capacity, and it is those trades out of the Far East into the US which have seen the biggest increase so far in 2024.
In the first 10 weeks of this year, a total of 4.76m TEU of cargo carrying capacity departed the Far East bound for the US, up by 16.2% compared to the same period in 2023.
Within this overall Far East to US figure, capacity is up by 17.4% on the Transpacific into the US West Coast and 14.6% to the East Coast.
As stated, the relationship between capacity and demand is a key driver in terms of the cost of ocean freight shipping, so we must also look at volumes during this period to gain a clear picture of the market.
The most recent figures for January 2024 show volumes from the Far East into the US were up by 24.1% compared to January 2023.
You may ask where this additional capacity between the Far East and US in 2024 is coming from...
The Ocean Alliance maintains its position as the biggest provider of capacity between the Far East and US, despite having the lowest year-on-year growth out of the three global alliances.
In the first 10 weeks of 2024, Ocean Alliance offered an average capacity of 172 800 TEU per week, which is an increase of 4.1% from the same period in 2023.
Elsewhere, THE Alliance increased its capacity between the Far East and US by almost 30% compared to the first 10 weeks of 2023 to stand at 116 700 TEU per week, while 2M increased capacity by 35.5% to stand at 101 110 TEU.
Capacity falling from the Far East to Europe
In terms of demand for ocean freight container shipping, it has been a similar story between the Far East and Europe with a 7.1% increase in volumes in January this year compared to January 2023.
That is where the similarity with the Far East to US trade ends however, because when we consider the all important relationship between supply and demand, we see capacity is down 5.3% from the Far East to Europe.
The biggest drop in capacity is found on the trade from the Far East to Mediterranean, down 9.4% in the first 10 weeks of the year, while capacity into North Europe has fallen by a lesser 2.8%.
Let’s take a look at where the capacity is coming from on the Far East to Europe trades…
2M has overtaken the Ocean Alliance as the largest provider of capacity from the Far East to Europe. The former has grown its capacity to average 135 650 TEU per week in the first 10 weeks of 2024, while the latter has fallen to 134 700 TEU, down 13.9% compared to the same period in 2023.
However, the biggest change on the Far East to Europe trade compared to last year is found in the level of non-alliance capacity offered, which has increased 285.4% compared to last year.
This is, perhaps unsurprisingly, driven by MSC which is averaging 20 500 TEU per week in 2024 through standalone services outside the 2M Alliance. For comparison, in the first 10 weeks of 2023, MSC did not offer any standalone capacity between the Far East and Europe.
Offering the same service now requires far more ships
Despite the situation in the Red Sea causing longer sailings around the Cape of Good Hope, carriers have still succeeded in maintaining much of their service schedules.
This has been achieved by introducing more ships into these trades. Logically, more ships should increase cargo carrying capacity, but when these ships are sailing longer distances – and therefore taking more time to reach their destination – it does not mean there has been an increase in the weekly capacity available to shippers on these trades.
To explain this situation using a real world example, let’s take a look at the Ocean Alliance’s MEX1 Far East to Mediterranean service.
In the first 10 weeks of 2024, capacity offered on this service is down 32.2% compared to the start of 2023. This is partly due to Ocean Alliance operating slightly smaller ships as well as three blanked sailings (in the first 10 weeks of 2023 there was only one).
However, while weekly capacity available to shippers has fallen, the cargo carrying capacity deployed on this service is flat compared to the same period in 2023 because Ocean Alliance has added ships to mitigate the longer sailing distances around the Cape of Good Hope and maintain service schedules.
2M’s Far East to North Europe Silk Service is another good example. Weekly available capacity offered on this service in the first 10 weeks of 2024 is flat compared to the same period in 2023.
However, to maintain the same schedule offering as 2023 while also taking a diversion around Africa, the alliance partners have had to introduce 21% additional shipping capacity, with 17 ships now active on this service.
The map image, right, shows the location of vessels on 2M’s Far East to North Europe Silk Service on 20 March.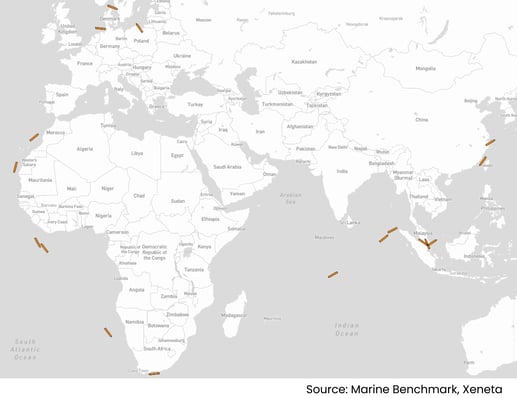
The pressure on capacity due to increased sailing distances will be central to carriers’ arguments for Red Sea related surcharges and rates increases.
However, that position appears to be weakening with the Xeneta platform indicating a softening of the market on trades from the Far East into the Mediterranean and North Europe since their peak in January.
Data on the Xeneta platform is also suggesting early indications of a further drop in average spot rates on 1 April. We will bring you further insight on the development of both the long and short term rates on these trades as the market develops during 2024.