The recent trend of globally falling spot freight rates has brought transport costs back on par on the main transpacific corridors of containerized exports from APAC to the US West Coast.
In the early days of 2021, the relationship that was usually separated by little more than USD 100 per FEU began to split up.
It was a slight change at first, but as the pandemic continued to wreak havoc on all trade lanes in May 2021, it became more expensive to ship out of Asia from any non-China origin - in South East Asia as well as in North Asia.
Read more below in Xeneta's weekly container rate update.
APAC exports to US West Coast
One year ago, by mid-September 2021, the price spread peaked at USD 3 800 per FEU but has now fallen back to zero in 2022. Moreover, the spot freight rates are currently down to their lowest level since April 2021.
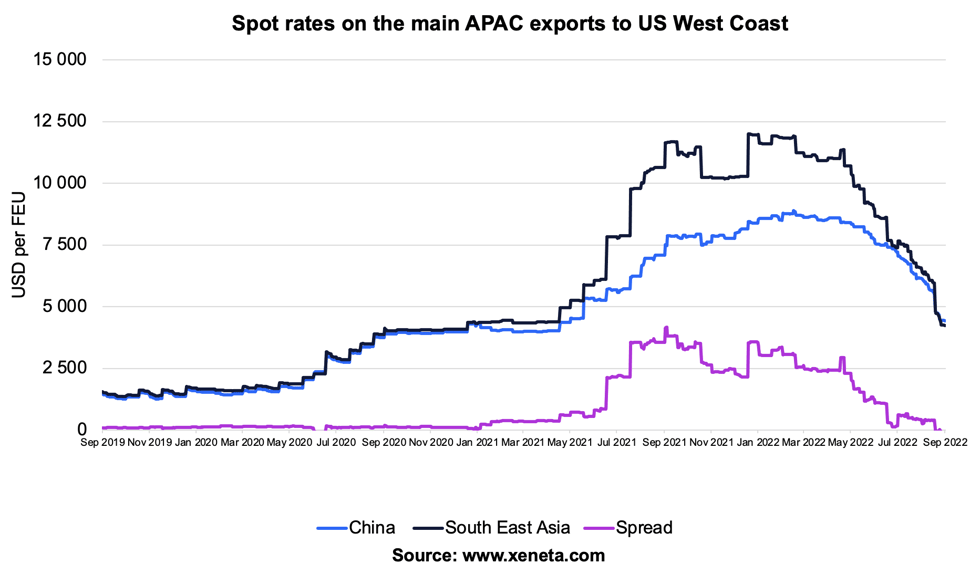 The spread on these two trades was minimal up until January 2021, when the average rate from South East Asia stood at USD 4 360 per FEU and those from China at USD 4 290. From then, the spread started to increase as rates out of South East Asia rose faster and to a higher point than those from China.
Spot rates from South East Asia to the US West Coast peaked at just under USD 12000 in January 2022, whereas those from China ‘only’ got to USD 8 700 and peaked in March.
Since then, the fall in rates out of South East Asia has also been faster than those out of China - the key to bringing the spread down. Since the end of March, rates from South East Asia to the US West Coast have fallen by 62%, while those from China are down 49%.
Currently, the average spot rate to the US West Coast from the Far East and South East Asia is USD 4 300 per FEU, with China slightly more expensive.
Note:
The 'Weekly Container Rates Update' blog analysis is derived directly from the Xeneta platform, and in some instances, it may diverge from the public rates available on the XSI ®-C (Xeneta Shipping Index by Compass, xsi.xeneta.com. Both indices are based on the same Xeneta data set and data quality procedures; however, they differ in their aggregation methodologies.
Want to learn more?
The container market is no walk in the park. You need to have the latest rate and supply data to be able to plan and execute your freight procurement strategy quickly.
Xeneta's real-time and on-demand data is here to help you answer, "Am I paying the right freight rate to get my cargo where it needs to be?"
Sign up for our weekly 15-minute live group demo below and see Xeneta for yourself.