This week's weekly rate update covers trades into Australia and New Zealand as the average of all long term freight rates in the region has reached new highs in July among the three largest trades.
In recent months the average rate for new long term contracts has stabilized. However, with these new contracts replacing older ones at much lower levels, they still contribute to an increase in the average for all valid long term contracts. For example, on by far the biggest trade into Australia and New Zealand, the average long term rate from the Far East on 1 July stood at USD 7 600 per FEU, 375% more than what shippers were paying in July 2019 and more than twice as high as in July 2021.
Read more on Xeneta's latest weekly container rate update.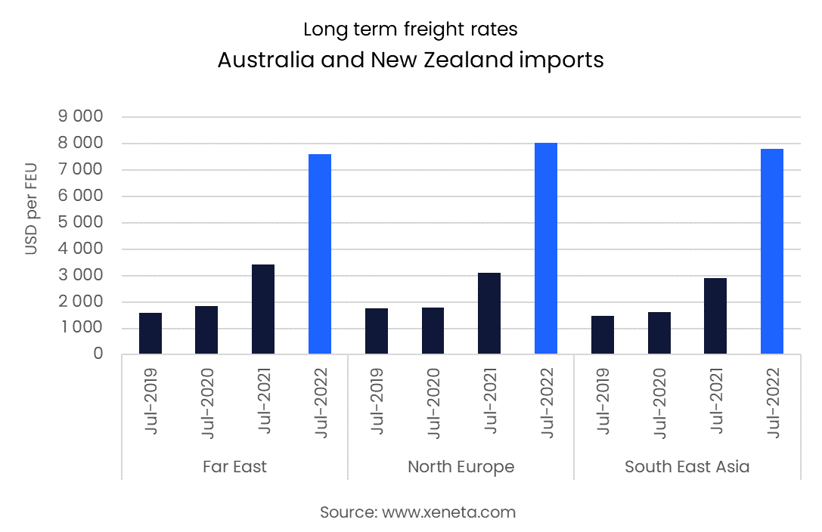
In the first five months of the year, 41% of total containerized imports to Australia came from China, followed by South East Asia, from where 20% of total imports came.
Containerized imports to New Zealand are far less dominated by China and South East Asia, as they account for 22% and 13% of total containerized imports.
In total, in the first five months of the year, Australian containerized imports are down by 7.6%, while those to New Zealand have fallen by 13.5%.
The largest percentage increase comes in long term contracts from South East Asia, which are up by more than 420% from July 2019, rising by USD 6 300 per FEU so that the average cost is now USD 7 800 per FEU. It is also the trade that has seen the largest year-on-year increase, as in July 2021, the average rate was ‘just’ USD 2 900 per FEU.
Long term rates from North Europe are the most expensive of these four trades and the only ones above USD 8 000 per FEU, having risen by 160% from July last year. This is despite the fact that volumes on this trade have fallen by 4.2% in the first five months of 2022, compared to the same period in 2021 and slightly down from the first five months of 2019.
Note:
The Weekly Container Rates blog analysis is derived directly from the Xeneta platform, and in some instances, it may diverge from the public rates available on the XSI ®-C (Xeneta Shipping Index by Compass, xsi.xeneta.com. Both indices are based on the same Xeneta data set and data quality procedures; however, they differ in their aggregation methodologies.
Want to learn more?
The container market is no walk in the park. You need to have the latest rate and supply data to be able to plan and execute your freight procurement strategy quickly.
Xeneta's real-time and on-demand data is here to help you answer, "Am I paying the right freight rate to get my cargo where it needs to be?"
Sign up for our weekly 15-minute live group demo below and see Xeneta for yourself.