Over the past five weeks, carriers have continued to blank sailings in response to lower demand on the three largest trade lanes out of the Far East bound for North Europe, North American East Coast and North American West Coast.
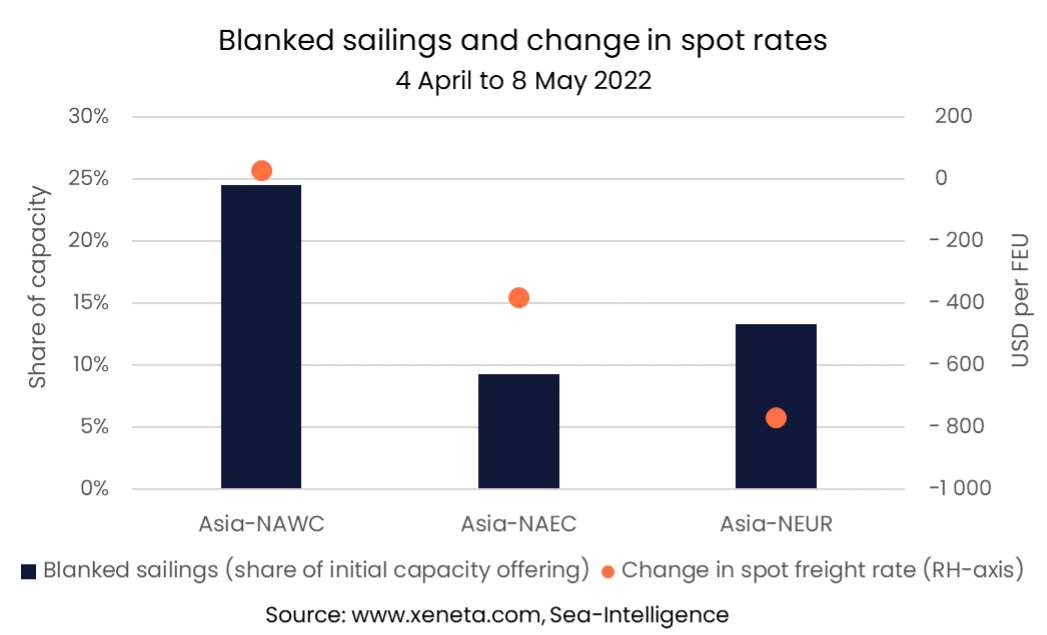
Out of the three trade lanes, the Far East to US West Coast trade had the most blanked sailings, both in absolute volume and as a share of offered capacity, between 4 April and 8 May. 63 sailings were blanked in the five-week period, removing a total of 517,300 TEU, 25% of the initial capacity offering.
Read more on Xeneta's latest weekly container rate update.
Blanked Sailings And Freight Rates
This trade was also the only one where spot rates didn’t fall over the five weeks. Spot rates from the Far East to the US West Coast increased slightly (+ USD 30 per FEU), landing at USD 9 250 per FEU on 8 May.
This is the most obvious of the three trades for shippers to look at and question whether carriers are removing capacity to safeguard high spot freight rates, while on the other two trades, fewer sailings were blanked, and spot freight rates fell.
 Out of the three trades, the Far East to US West coast trade had the largest decline in demand in Q1, falling 3.5% Y-o-Y. Despite this, it is the only one of the three trades that didn’t see spot rates fall between 4 April and 8 May, which can partly be explained by the large share of sailings that were blanked by carriers.
Despite volumes growing on the Far East to US East Coast trade, spot rates here fell in the five weeks to 8 May, down USD 380 per FEU to USD 11 600 per FEU. This trade lane saw the lowest amount of blank sailings, where 263 500 TEUs were blanked, the equivalent of 10% of capacity. Compared to earlier weeks, this trade lane is the only one to have seen a decrease in the amount of sailings being blanked as carriers adjust to the higher demand. Despite the blanking of sailings, available capacity remains high enough for spot rates to fall, even though volumes are record high on this trade. (source: CTS)
The Far East to North Europe trade had the largest fall in spot freight rates, down USD 770 per FEU, with falling demand outweighing the 13% of the capacity that was blanked between 4 April and 8 May. 223 000 TEUs were blanked on this trade out of the 1.5m TEUs that had initially been announced.
The number of blank sailings from the Far East to North Europe hasn’t increased significantly from earlier in 2022. Despite volumes being down, capacity has been higher on this trade this year than in 2021, which in turn has put downward pressure on spot freight rates, which have fallen since the first weeks of 2022.
Note:
The Weekly Container Rates blog analysis is derived directly from the Xeneta platform, and in some instances, it may diverge from the public rates available on the XSI ®-C (Xeneta Shipping Index by Compass, xsi.xeneta.com. Both indices are based on the same Xeneta data set and data quality procedures, however, they differ in their aggregation methodologies.
Want to Learn More?
Book a free DEMO now to learn more.
If you have any questions, please send them to info@xeneta.com.