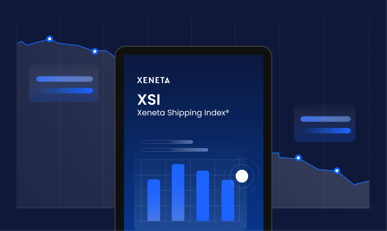
The Global XSI®, which calls upon Xeneta’s crowdsourced data to measure the average of all long term contracts in the ocean freight shipping market, posted its biggest month-on-month increase since June 2022, rising by 4.3% in February to 154.4 points.
February marks only the second month in which the Global XSI® has risen in the past year-and-a-half.
This is largely due to surcharges related to diversions in the Red Sea being added to existing long term contracts, particularly on trades between Asia and Europe.
US – crucial period ahead of contract negotiations
TPM24, taking place in California next week, signals the start of negotiations with many US importers for new long term contracts and carriers may point towards the global XSI®, plus a 180% increase in the spot market on the Transpacific trade since mid December, as justification for increasing rates in the new agreements.
On the other hand, US shippers will point towards the XSI® sub index for US imports, which remained relatively flat in February, down 3.3% to 176.1 points, plus a now softening spot market, as justification for negotiating a long term contract more in line with their existing agreement at a lower level.
Michael Braun, Xeneta VP of Customer Success & Solutions, said: “This is the million-dollar question ahead of negotiations because both the carriers and shippers have extremely strong positions. The problem is they are some thousand dollars per FEU apart in what they are aiming for.”
Europe
The index for European imports rose by 8.6% in February, a marked turnaround from the 18.4% drop it registered in January. The index now stands at 156.2 points, which is 63.1% lower than a year ago.
The XSI® for European exports rose by a much smaller 1.3% in February to 165.1 points.
Far East
The XSI® for Far East exports rose by 13.0% from January leaving it at 152.9 points. Much like with the Global XSI® this is only the second month-on-month increase posted by this index in the past 18 months.
Far East imports takes the top spot on the XSI® in February, growing by 13.5% from January to leave it at 112.8 points.
Related Resources:
Get the latest insight and information on the Red Sea crisis on the Xeneta newsfeed.
Get the full XSI® report:

Note: Xeneta's XSI® is compiled from the latest crowd-sourced ocean freight rate data aggregated worldwide. Companies participating in the benchmarking and market analytics platform include names such as ABB, Electrolux, Continental, Unilever, Nestle, L'Oréal, Thyssenkrupp, Volvo Group and John Deere, amongst others.

Market transparency is a must-have
Gain crucial insights into the unpredictable container shipping market. Stay ahead of the game by accessing the intelligence and visibility necessary to adapt swiftly to shifting market conditions. Don't miss out on securing the success of your team and business.
Know instantly how your air and ocean freight rates compare against the market, justify your transportation costs, prepare for your tender period and report on your success with one powerful easy-to-use platform. Book a demo now!