-1.jpg)
The January 2019 Xeneta Shipping Index public update and commentary on the long-term market is now available. Here is a snippet of how that market has moved so far in January on the main trade corridors.
Excerpt below. Get the full Jan 2019 XSI report (PDF) with all graphs here.
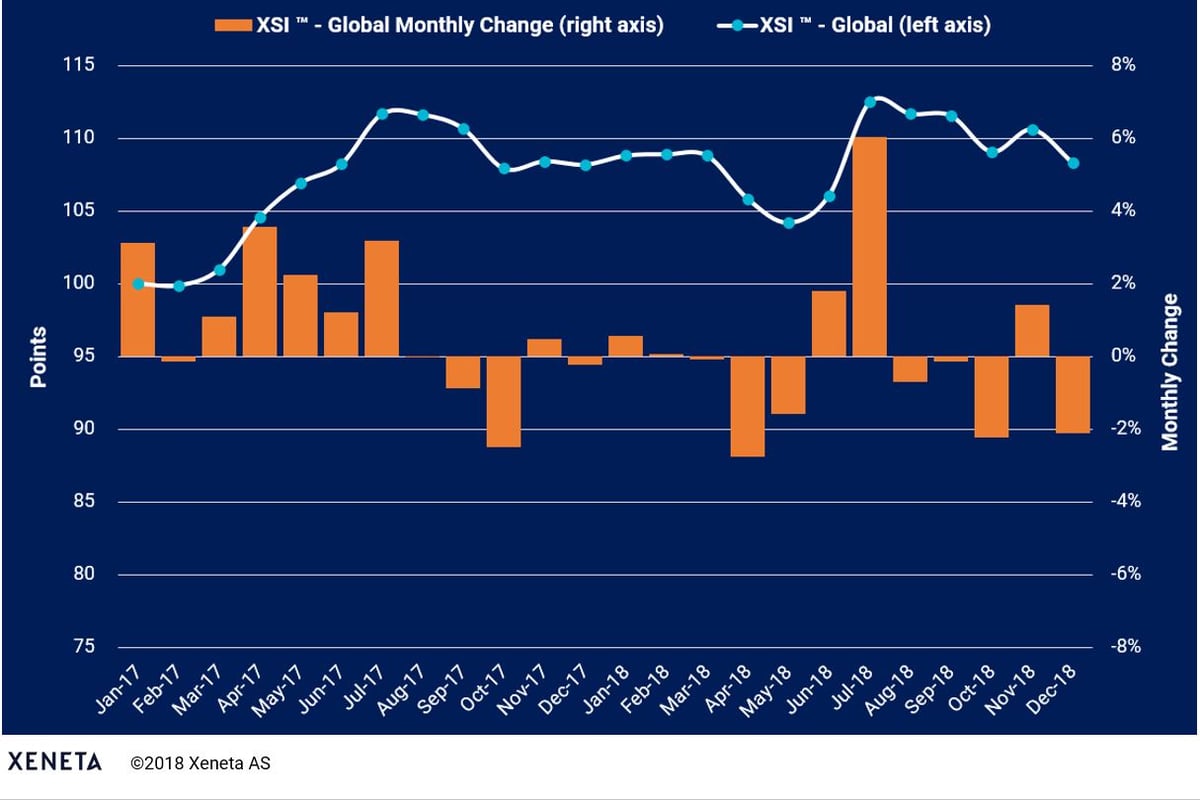
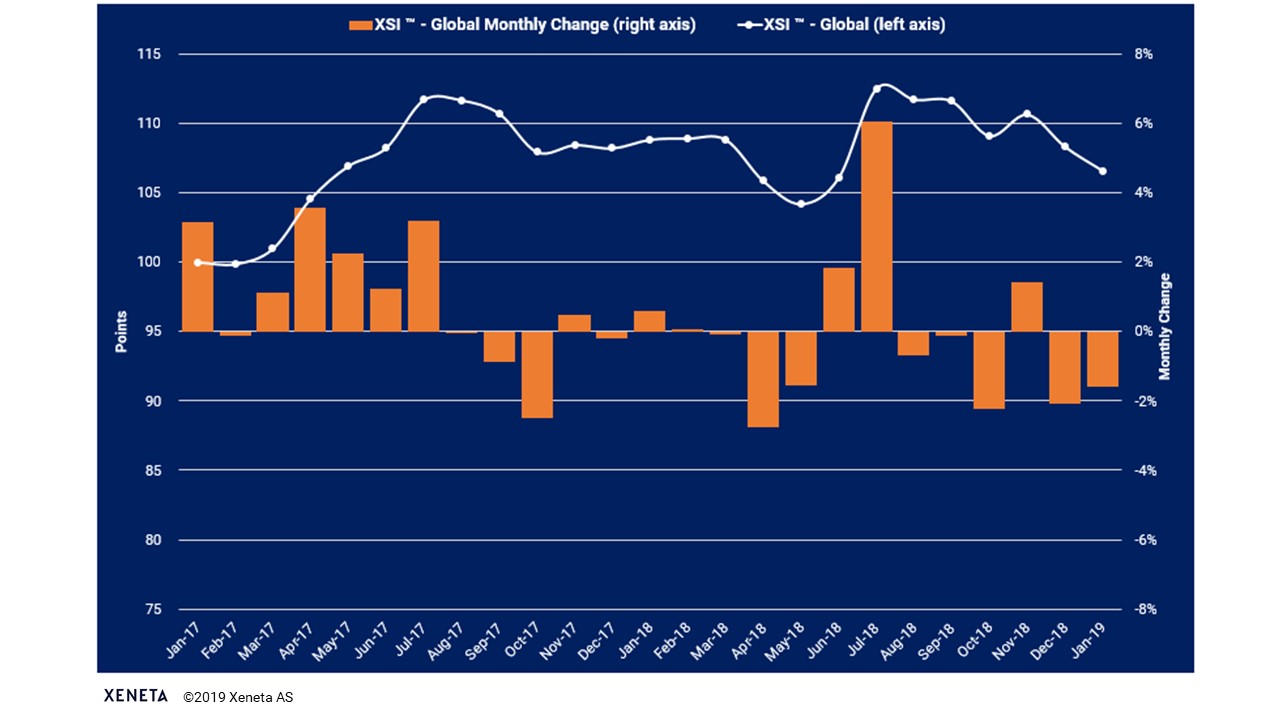
The global XSI ™ fell 1.6% in Jan-19 to 106.58 points, continuing the downward trend recorded since Aug-18. During this six-month period, the index has lost 5.3% of its value, having shed 5.92 points and now stands at a similar level to that recorded in May-17.
Year-on-year the global benchmark is 2.1% lower than Jan-18. However, if the index reports similar changes to those witnessed during the first few months of 2018, then we may only see minimal changes in the next few months.
XSI ™ - Europe Imports / Exports
In Jan-19 European imports on the XSI ™ fell 1.3% month-on-month to 108.01. However, compared to the same period a year earlier, it remains 3.0% higher.
Exports on the benchmark declined 2.3% to 107.73 points and the index now stands at its lowest level since Jun-17, having failed to maintain any positive momentum.
XSI ™ - Far East Imports / Exports
The Far East Imports XSI ™ jumped 2.3% in Jan-19 to 115.98 temporarily reversing a downward trend seen since Sep-18.
The Far East Exports index declined 0.3% in Jan-19 to 115.85 points. Despite the fall, it remains 1.0% higher than Jan-18, although is 5.6% lower than the high of 122.78 points recorded in Jul-18.
XSI ™ - US Imports / Exports
The XSI ™ for US imports declined 1.7% in Jan-19 to 98.86 points and is now 1.0% lower than the equivalent period of 2018.
Meanwhile, the US exports XSI ™ fell 1.0% month-on-month in Jan-19 to 86.64 points. The benchmark has remained on a downward trajectory since its inception and is 8.0% lower than the level of 94.20 recorded in Jan-18.
###
Don't miss out! Get your copy of the full Jan 2019 XSI report (PDF) with all graphs now. Xeneta Shipping Index Public .