


2023 has seen further chaos in ocean freight rates as carriers battle to balance capacity and demand – but have these choppy financial waters brought unintended environmental benefits?
It’s time to take another deep dive into Xeneta and Marine Benchmark’s Carbon Emissions Index (CEI) to explore the green credentials of carriers across the world’s major trade lanes during Q2 2023.
The CEI provides clarity and visibility on carriers’ emissions, allowing shippers to put environmental sustainability at the heart of their decision making.
These environmental considerations are not going away – in fact the importance of Xeneta’s CEI is growing ever stronger following the introduction of the IMO’s Carbon Intensity Indicator (CII) regulations at the start of 2023 and the EU’s Emissions Trading Scheme (ETS) in January next year.
So, let’s find out who takes the title of Q2’s greenest carrier and whether those CII regulations have started to make an impact…
Shipping is getting greener…
The CEI paints an improving global picture with Q2’s average scoring across the 13 major trade lanes being lower than Q1.
This looks even more favorable when we consider 8 of the 13 lanes saw carbon emissions per tonne of cargo carried being lower than the corresponding period in 2022. The standout lanes were North Europe to South American East Coast and US West Coast to Far East which posted year-on-year CEI reductions of 31.6 and 21.8 index points respectively.
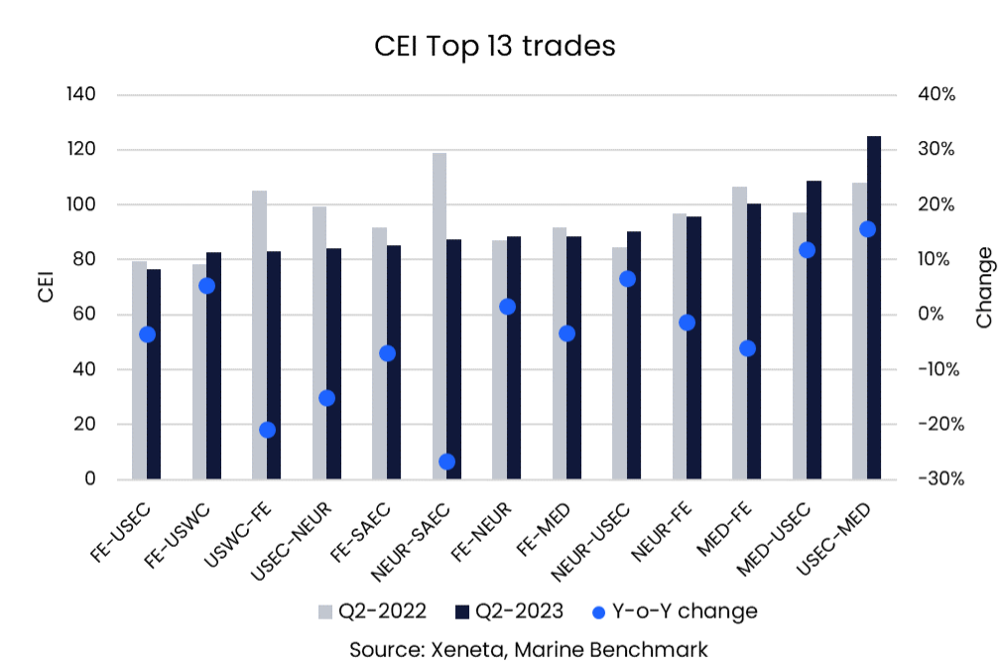
When we drill down into the Xeneta data we see the emissions gains made in these two lanes is due to larger ships and a reduction in speed – two metrics which carry significant weight in the CEI.
If we take a slightly longer view and compare Q2 2023 with Q1 2018 (the starting point of the CEI) we see that only three of the 13 major trades post higher emissions. Chief among these is the backhaul trade from the US East Coast to the Mediterranean which now sits 25% higher on the index than it did five years ago.
The long view reveals a more positive scene on other trades however, with the biggest mover being the Far East to US East Coast which has seen CO2 emissions fall by 23.3% between Q1 2018 and Q2 2023. In fact, there is largely good news across all major trades out of the Far East which have each improved by at least 11.4%.
Capacity management is key to securing filling factor
Managing capacity has been a tug of war during Q1 and Q2 as carriers have been met with a 3.3% drop in global container demand and a 5.9% increase in the size of fleet.
Not only does this create poor financial market conditions for carriers, it also has carbon emissions consequences – it’s hard to be environmentally efficient when you are running ships half empty.
The natural response from carriers to this conundrum is to remove capacity from some of the major trade lanes in order to protect freight rates – and so begins the chain reaction throughout the world’s shipping network.
We can clearly see the redeployment of ships onto the onto smaller trades through the average filling data across the 13 major trades
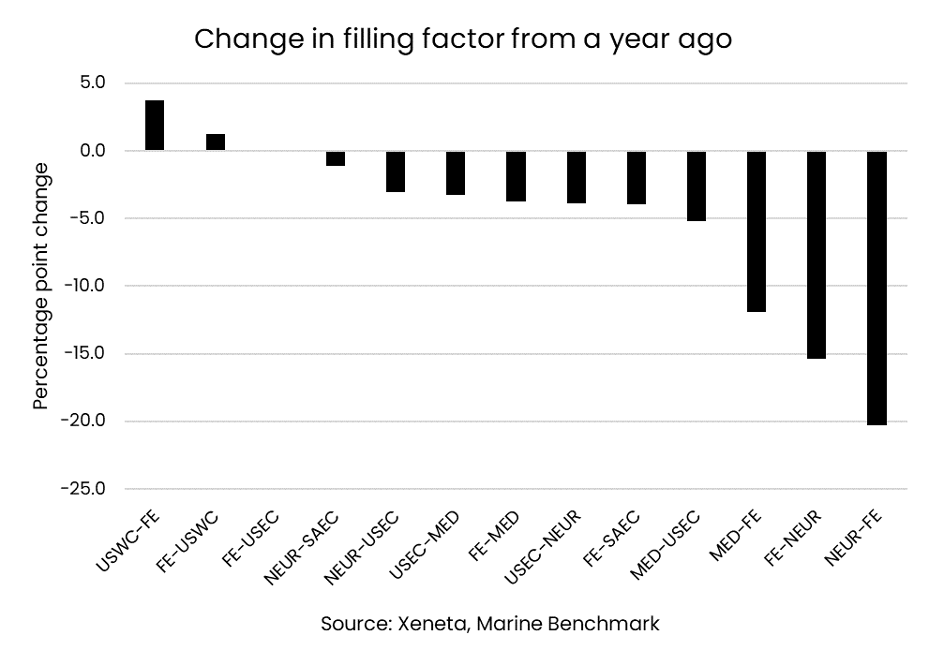
The only trade lanes which increased filling factor and capacity between Q2 2022 and Q2 2023 are the Far East to Mediterranean, North Europe and South American East Coast, with all three seeing slight year-on-year volume growth.
The filling factor on seven other trades fell by between one and five percentage points, which at first glance suggests carriers haven’t been particularly successful in their capacity management. But when we look at the scale of drops in volume we see carriers have possibly been more successful than we may think in limiting the damage.
For example, the average filling factor in Q2 for Far East to US West Coast was 3.9 percentage points lower than Q2 2022 – not a particularly successful outcome from a carrier perspective, right?
But when we put this into the context of a 14.5% drop in volumes and the removal of 7.9% of capacity, we start to see that, while it’s not a particularly pleasant picture for carriers, it’s not as gruesome as it could have been.
The interconnectedness of global shipping and the redeployment of ships means what you gain on some lanes, you lose on others.
The biggest year-on-year deficit in filling factor is found between North Europe and US East Coast which is down 20.3 percentage points. So it shouldn’t come as a surprise that carriers added 24.7% more capacity to this trade in Q2 compared to the same period in 2022 – despite demand falling. This trans-Atlantic trade seems to have become the dumping ground for ships being taken off major trades out of the Far East.
Slow steaming brings emissions benefits
The other major factor on environmental efficiency is speed – or more rather the lack of it.
Each of the eight major trades which registered a year-on-year CEI decrease in Q2 also reported a decrease in average speed. The ongoing trend for slow steaming has been brought about globally due to the poor market conditions and carriers looking to limit the effects of over capacity on freight rates.
The chain reaction is at play once more with consequences of slow steaming helping carriers to comply with CII regulations and reduce their CEI scores.
The biggest reduction in speed compared to Q2 2022 comes on the North Europe to South America East Coast which saw ships slow by an average of 3.8 knots. Only two of the major 13 trades failed to see average speed decrease in Q2 compared to last year, namely Far East to North Europe and Far East to US West Coast.
New ships might not be what carriers need right now, but there is a green upside
While causing a capacity headache for carriers, behemoth new ships have brought big emissions benefits on the major lanes during Q2.
Ships with a capacity of 12 000 TEU or more account for almost three quarters of new vessels and brought 1.1m TEU of capacity onto the market.
In a market already struggling with overcapacity this was the last thing carriers needed from a rate perspective, but the chain reaction has seen a positive impact on CEI scores.
This is because larger ships are more efficient in terms of CO2 emissions per TEU.
Compared to a year ago, 10 of the top 13 trades have seen an increase in the average size of ships deployed on them. The biggest of these increases is on the US West Coast to Far East trade where ship size gone from 7 900 TEU in Q2 2022 to 9 900 TEU in Q2 this year.
The title of biggest average ship size remains the Far East to North Europe, clocking in at 18 800 TEU.
The scores are in… and we have a new number ONE
The title of most CO2 efficient carrier on the highest number of trades during Q2 2022 on the CEI is Ocean Network Express (ONE).
It emitted the lowest CO2 per tonne of cargo carried from the Far East to the Mediterranean and US East Coast as well as from the Mediterranean to the Far East.
In second place we find Evergreen, Maersk and HMM who each top the rankings in two of the top 13 trades. There are a further four carriers who are the most carbon efficient on one of the top trades.
If we look at comparing carriers based on achieving below the market average CEI score on the greatest number of major lanes, then HMM comes out on top. Of the trades HMM operates on there was only one on which it didn’t outperform the market average in Q2.
Get an honest view of carrier emissions
Stay one step ahead of your competitors by making well-informed and sustainable choices when selecting shipping carriers. Xeneta and Marine Benchmark offer an independent and trustworthy Carbon Emissions Index (CEI) data, ensuring accuracy without any guesswork. By utilizing AIS tracking of real-time sailings on 48 major trade routes worldwide, with coverage expanding further in the near future, you can rely on up-to-date information. Don't settle for outdated and unreliable data. Schedule a demo of the CEI today and begin making intelligent shipping decisions. Get a demo here.

