


[This post and the rate data presented is from 2018. However, the analysis, case explanation, and conclusion are relevant and can be applied to today's market.]
In the complex area of supply chain management, shippers may be under the impression that each individual element within the chain determines the price set by sellers. However, in this two-part blog series, we look at what predominately determines rates and what challenges both shippers and the market face in determining a “fair” price for long-term contracts.
Table of contents:
PART 1
The Status Quo
What Really Drives Price
PART 2 - Market Inefficiencies
Contracting
Why It Matters
Pricing and Rate Visibility
It Comes Down to Data
The Status Quo
FOB, CIF, GRI, PSS, BAF, CAF, EBS, transit times, payment terms, demurrage clauses, and a whole lot more. In the ocean freight market, there’s no shortage of acronyms and individual specifications. However, the outcome is always the same, the transportation of a steel container measuring 20ft or 40ft from point A to point B.
With a market full of abbreviations and acronyms, and an endless list of origin/destination O/D pairs, it’s no wonder pricing can seem like a daunting task to all but the most experienced negotiator. Those selling freight are able to use this seemingly extensive combination of requirements to their advantage, arguing each has its part in determining price. By increasing the number of unique combinations and thereby limiting the number of comparable O/D pairs amongst peers, rate transparency declines to the detriment of the shipper.
Is this how sellers really determine their price?
In reality, pricing is predominantly a manual task, with basic spreadsheets not fit for calculating these complex combinations across thousands of O/D pairs while also accounting for current market conditions. Is it, therefore, with the current processes, feasible to account for all these factors in an accurate and timely manner?
What Really Drives Price
Timing, volume, and carrier need (supply/demand). Basic economics state that as demand outstrips supply, the price for a commodity will rise and vice versa. The ocean freight market is no exception.
Although it is argued that the ocean freight rates market is complex, the underlying product on the main trades is very much a commodity, which can be defined as a good or product that is readily interchangeable for those of a similar value. This accurately describes major O/D pairs, with rates offered by one seller regularly being transported via a different provider through alliances and slot shares, in other words, the product is interchangeable.
While a seller of freight might argue the product isn’t a commodity and that specific O/D pairs and requirements derive the price, it is the underlying market fundamentals that primarily determine its value.
This is no more apparent than in the major Asia-North Europe trade.
[Note - for the
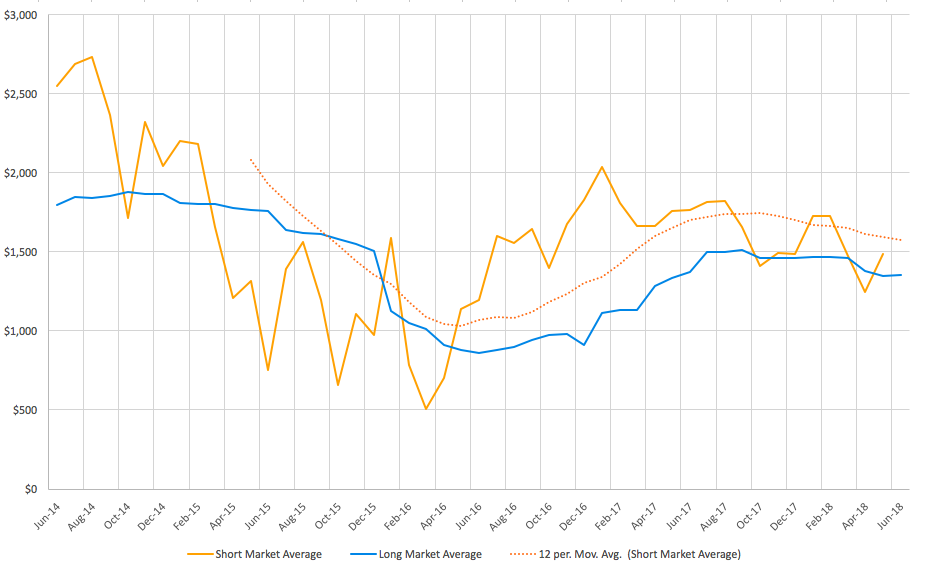
Fig 1: Far East Main to North Europe Main ($ FEU)
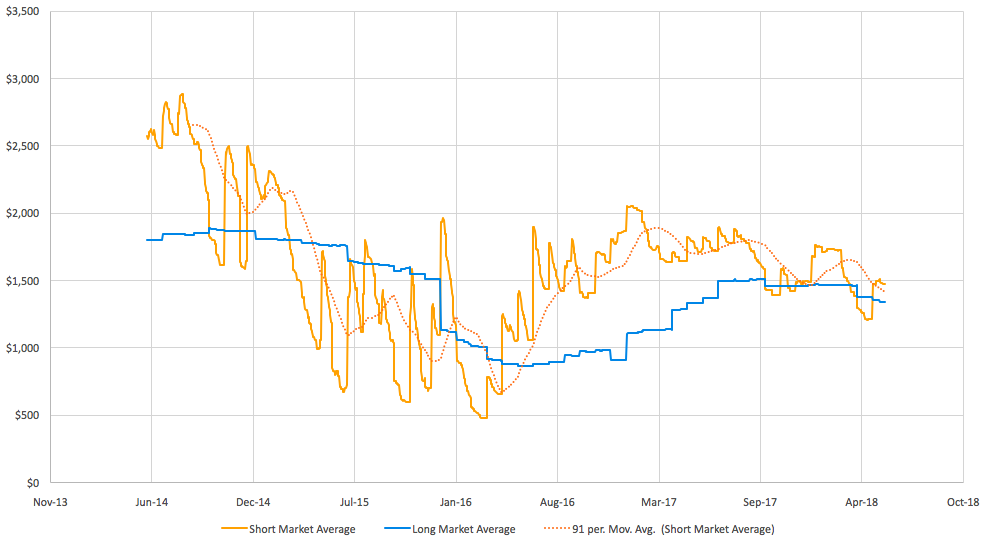
(Source: Xeneta)
Note: Fig 1 shows the market average short-term rate, alongside the market average long-term rate (12-month contracts). A 91-day (3-month) moving average allows us to see more easily the short-term market trend.
Fig 2: Far East Main to North Europe Main ($ FEU)
 (Source: Xeneta)
Note: The relationship between the two contract lengths is even more prominent if you track the monthly average short-term rate via a 12-month moving average, against the long-term market rate.
Both Fig 1 and Fig 2 highlight the relationship between short-term and long-term contracts. Although there is a delay between changes when the former impacts the latter, it is clear that there is a relationship between the two. If contractual rates were indeed determined by all the individual factors previously mentioned, then there would be little relationship between short-term and long-term rates.
Further evidence for this argument can be gleaned from analyzing long-term rates across a variety of sectors.
Fig 3: Far East Main – North Europe Main ($FEU by Sector/long-term market)
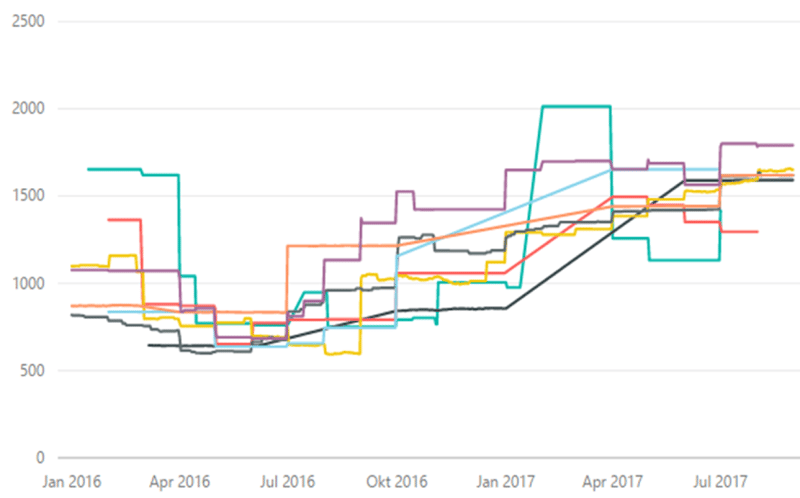
(Source: Xeneta)
Note: There is no pricing consistency between sectors. As a result, you cannot determine which sectors are “cheap” and which are “expensive”. While an individual carrier or representative may argue the commodity does influence the price, this simply doesn't hold true on a market-wide level. This is particularly the case once you take into account the supply/demand dynamics, which have a greater impact on rates. As Fig 3 demonstrates, on the whole, rates are set independently of the sector and commodity.
Fig 3 highlights that the industry sector has little or no influence on the long-term contract rates. If the opposite were true, then we would expect a much more consistent relationship between sectors.
As such, the evidence indicates that current supply and demand dynamics at any point in time play a vital role in deciding the price of both short and long-term contracts. This means timing can be crucial in determining what price you pay, adding weight to the argument that it makes little sense to tie yourself to setting contracts at a predetermined point of time each year.
Let's consider how this information can be used in a real scenario.
For example, how many of your peers have comparable routes, volumes and contract requirements that were negotiated at a similar time? Should these alone be used for benchmarking?
Taking these factors into account significantly narrows the opportunity for market comparison. In the example below, there are just three comparable contracts for a particular O/D pair, providing a very narrow level of visibility if taken in isolation.
Fig 4: China Main - North Europe Main (Long term contracts – FEU)
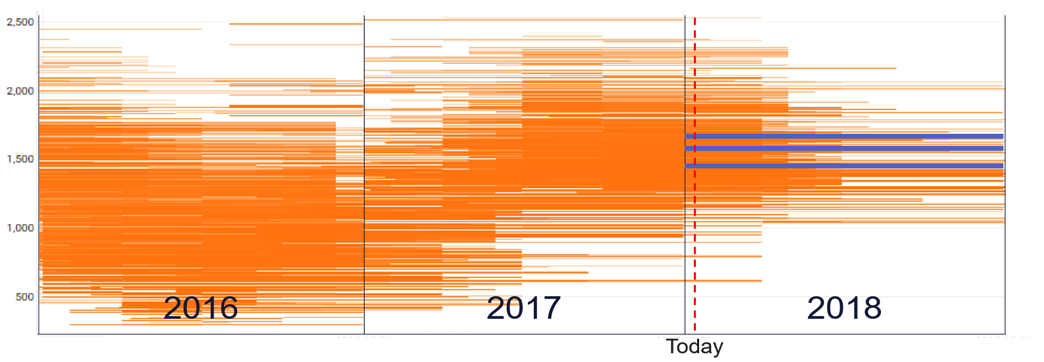 (Source: Xeneta)
Ask yourself the following:
Why only consider like-for-like contracts when analysis of the wider market can provide greater insight and benefits?
By taking a more holistic view, shippers can gain greater insight into the market as a whole, as well as historic or future rate trends. The more information a shipper has, the more informed they can be regarding a “fair” price, rather than relying on a limited data set that may bear little resemblance to wider market developments.
For example, the following chart now includes future rates, providing an insight into the market as a whole and how it is developing in the near future.
It also highlights that timing is crucial. Between Dec-16 and Mar-17 the market moved favorably for carriers, resulting in long-term contracts being negotiated substantially higher than just 3 months earlier.
Fig 5: Far East Main to North Europe Main ($ FEU)
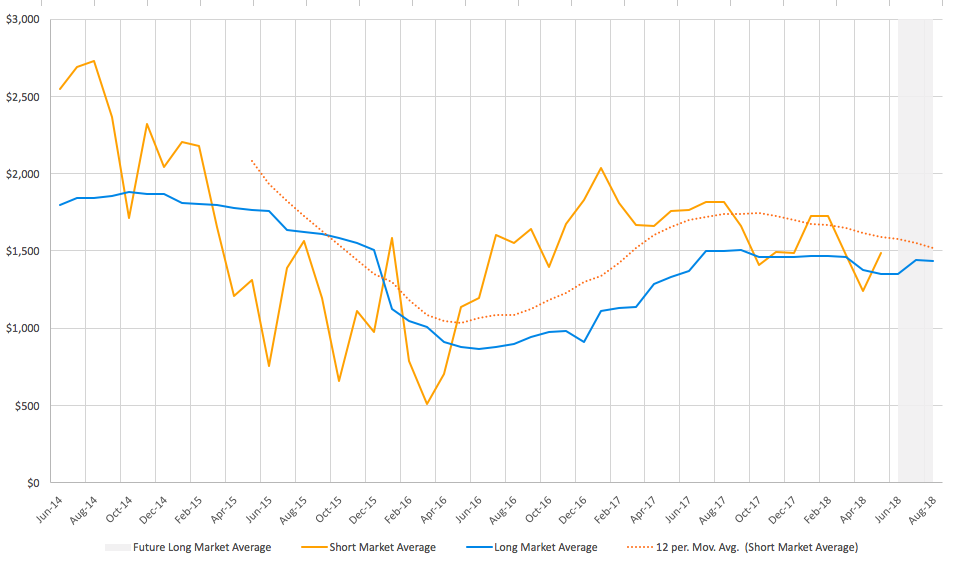
(Source: Xeneta)
Note: In Dec-16 the average long-term rate stood at $910 FEU. By Mar-17 this figure had risen to $1,133, representing an increase of 24.5%. The change in market fundamentals (supply/demand) along with your volume, will ultimately have a greater impact to your contracted rate compared to other pricing influences.
This holistic data can be used, alongside an understanding of how you have performed against the market historically, to build a more accurate picture of how you might expect your negotiations to play out.
For example, ask yourself:
1. How have you historically compared to the market?
2. What are the current and future market conditions impacting rates?
3. Are future average rate developments moving in line with what you are experiencing when negotiating?
These are the areas that need understanding and will have a greater impact on price rather than specific contract requirements or individual O/D pairs.
The market changed in 2011 when Maersk Line ordered its first Triple-E vessels, creating commoditized trades where the lowest slot cost wins. With rates on key trade routes on a long-term downward trend and with a market that is more transparent than ever, it becomes increasingly difficult for sellers of freight to apply a margin to their product offering. It is, therefore, understandable why the market tries to make price discovery as difficult as possible for shippers.
However, with transparency increasing, shippers are increasingly able to combat this by analyzing the market like never before, leading to more informed decision-making.
In the next part, we will consider some of the reasons behind the market’s complex pricing structure and both the challenges and possible solutions for buyers and sellers.

PART 2 - Market Inefficiencies
In Part 1 we looked at how price is really determined in the container freight market.
In this follow up we will consider some of the fundamental challenges facing the market, investigate some of the smaller trade lanes and discuss what shippers can do to address these problems.
Contracting - well, sort of
The example of Maersk reneging on a multimillion-pound contract with Argos and the subsequently reported settlement in 2010 is well documented but remains one of few high-profile settlements for contract non-performance. In nearly a decade little has changed in regards to long-term contracts, with the market still heavily relying on non-binding agreements. As a result, carriers are able to roll lower-priced contracted cargo with impunity, and shippers aren’t penalized for swapping suppliers during market troughs.
Ironically Maersk tried to address this issue in 2011 introducing performance guarantees in return for no-show penalties, however, the concept has never really taken hold. In a consistently oversupplied market, this is no surprise as carriers lack the appetite to implement this individually for the fear of losing volumes.
Meanwhile, for shippers on commoditized trades, there is minimal benefit in locking yourself into one carrier when you can continue with the market “norm” and take your volume elsewhere for a discounted rate. After all, there is very little if any differentiation between the service carriers provides on the major trades.
Those with the largest volumes, freight forwarders, also benefit from the current system. The ability to switch volumes from spot to named accounts and vice versa provides them with a level of flexibility they would otherwise struggle to achieve.
Why it Matters
The non-binding nature of most agreements in the market comes to the detriment of those wanting absolute certainty, however, it also has ramifications across the wider market.
Firstly, it creates huge inefficiencies, a particular concern for carriers when cost control is so vitally important. Carriers are forced to provide quotes based on volumes, which are by no means guaranteed, making accurate pricing even harder. Meanwhile, for shippers requiring absolute certainty, there is no guarantee contracted cargo won’t be rolled if the market spikes, ultimately leading to wasted man-hours and resources negotiating the agreement in the first place.
With the major of trades now commoditized, it’s more important than ever to ensure shippers get a fair price, which can only be achieved through rate visibility.

Pricing and Rate Visibility
Let’s start by looking back at the most documented trade, Asia-North Europe.
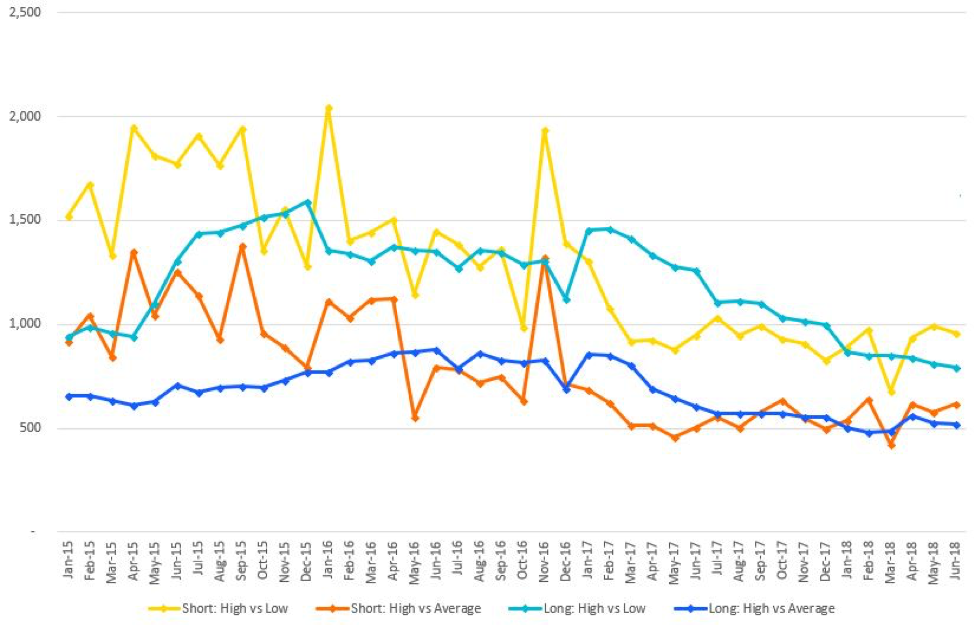
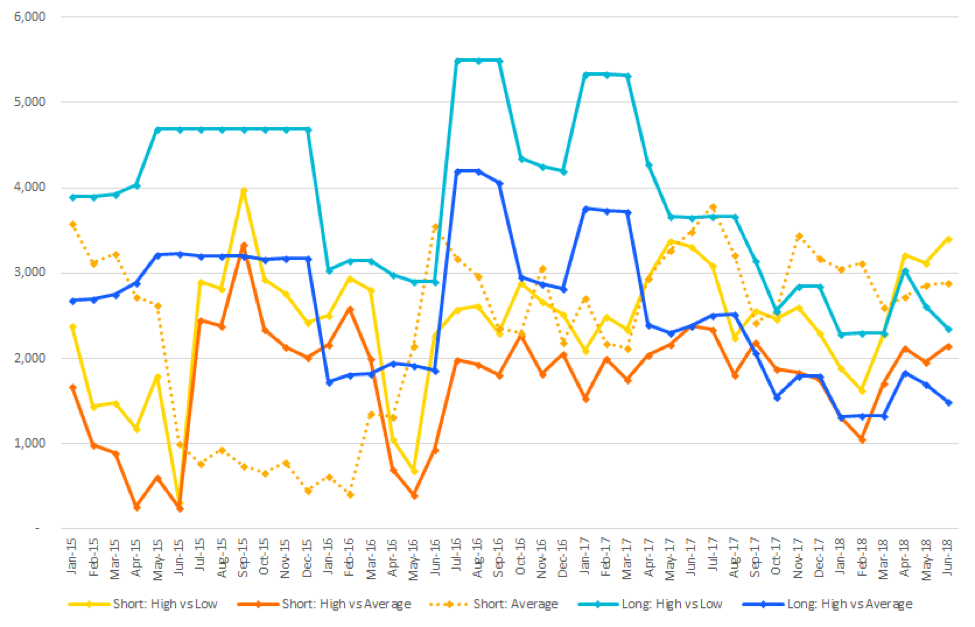
Fig 1. Market Spreads Far East Main to North Europe Main ($FEU)
 (Source: Xeneta)
Note: The chart highlights the price difference between the market high and market low for both long (12 months) and spot cargo (short). The same is also shown for the market high versus the market average.
Fig 1 demonstrates, on what is arguably the most transparent trade lane, that since early 2017 the difference between the market high and market low for long-term contracted cargo has been trending downwards. For shippers traditionally paying the market high this represents good news, they have managed to close the gap between what they are paying and the market low.
It could be argued this is a direct result of increased transparency on the trade, which inhibits the ability of carriers to “overcharge” shippers, who are more informed than ever about what the market rate is at any given point in time.
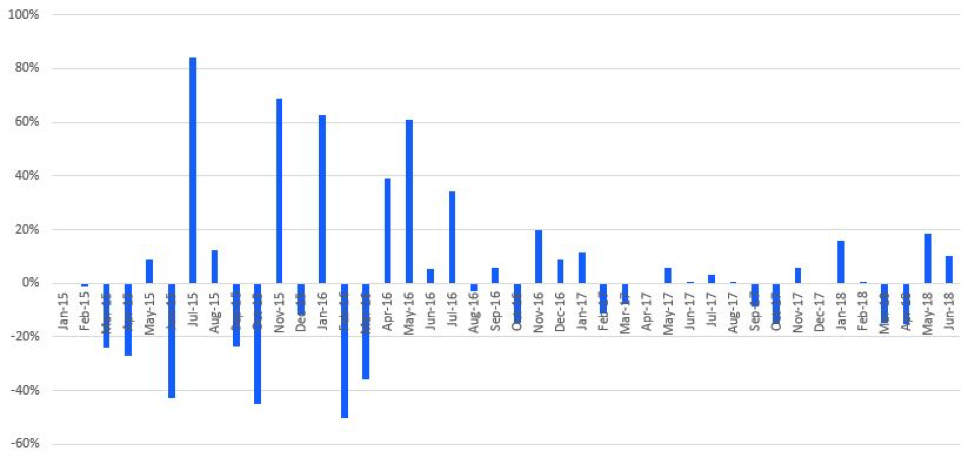
Meanwhile, Fig 2 shows that the month-on-month change in the market average short-term rate has fallen noticeably since 2016. Again, it could be argued this reduced volatility is a direct result of increased transparency, with carriers less able to implement short-term increases due to a more knowledgeable market.
Fig 2: Far East Main to North Europe Main Month-on-Month Change
(Source: Xeneta)
Note: Fig 2 highlights the month-on-month (MoM) change in the underlying short-term rate. Since mid-2016 these MoM changes have reduced, followed by a reduction in the spread between the market high and market low in both short and long-term rates as seen in Fig 1.
Let's now consider the differences on a less documented route.
While we could clearly see the difference between the market high and market low have narrowed on the Far East Main to North Europe Main route (see Fig 1.), the opposite has been true on the backhaul route.
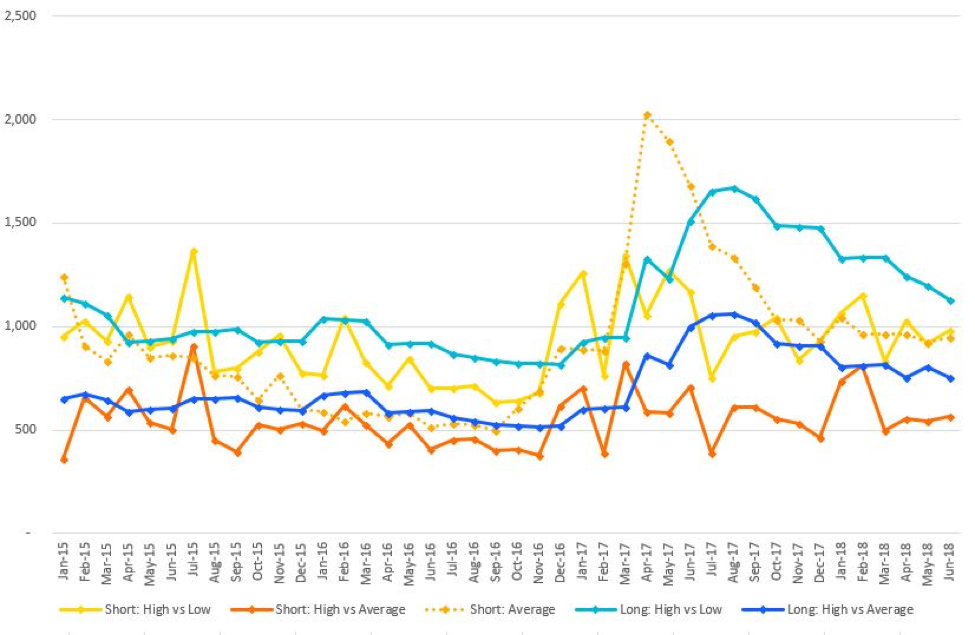
Fig 3: Market Spreads North Europe Main to Far East Main ($FEU)
 (Source: Xeneta)
Note: The difference between the long market high and low, as well as the long market high and average, have both increased significantly since early 2017. This is directly correlated to an increase in the underlying spot market (Short: Average).
Since 2017, on the North Europe Main to Far East Main trade, the spread between the market high and market low has widened substantially. This follows an increase in the underlying spot market, providing further evidence that market fundamentals drive contracted rates and not the individual specifications of a shipper.
While the increase in the spread follows a jump in the spot market, it appears it is the higher paying customer that bears the brunt of the increased rates. i.e if the market was consistent then the spread would remain the same. However, Fig 3 shows that higher paying customers have seen their rates increase disproportionately more compared to both the market average and market low. This is reflected by the Long: High vs Low and Long: High vs Average both following the spot market up.
What Fig 3 also shows is value can be derived by prolonging long-term contract negotiations. Since Sep-17 the aforementioned spread has started to narrow, with higher paying customers achieving a rate closer to the market low.
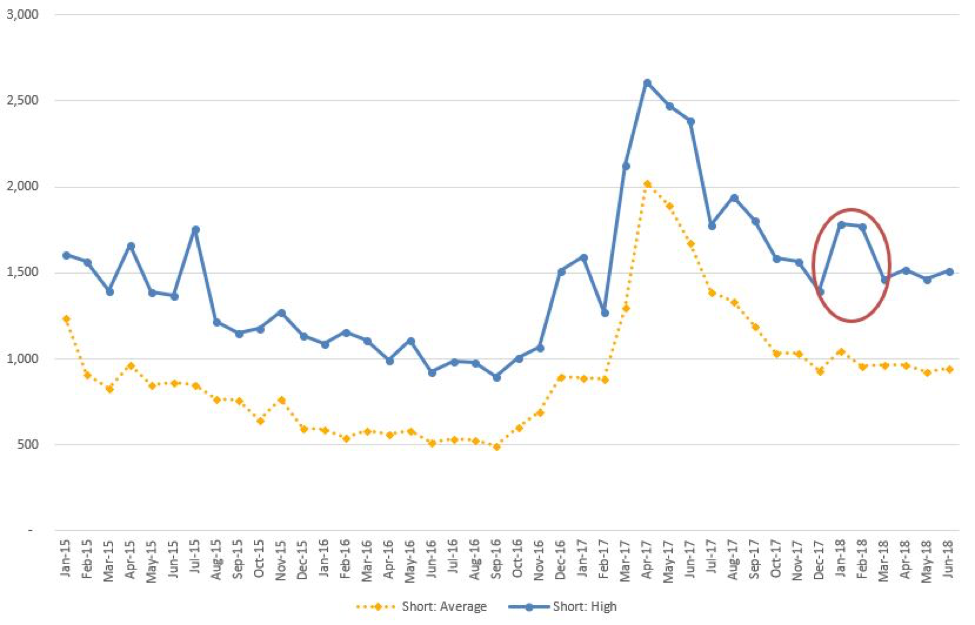
There are also inconsistencies in the spot market. For example, in Feb-18 there was a sudden jump in the spread between the short market high and short market average. This can be seen more easily if we isolate the two. See Fig 4.
Fig 4: North Europe Main to Far East Main ($FEU)
(Source: Xeneta)
Note: As reflected by the increased spread seen in Fig 3 the higher paying customer witnessed a large jump in rates, despite little change in the market average.
This information should lead shippers to question whether it is reasonable for their rates to significantly increase compared to movements in the market average?
Meanwhile, on the Far East Main to East Coast South America trade we can see clear rate inconsistencies, particularly in the spot market.
Fig 5 below shows spreads in the spot market remain highly volatile, suggesting there is no pricing consistency between the highest and lowest paying customers. In contrast to the spot market, the spread between the market high and market low for long-term contracts has steadily declined since the beginning of 2017. This is despite no noticeable drop in the spot market and could be attributed to increased visibility on the trade, as well as market oversupply and therefore increased rate competition.
Fig 5: Far East Main to East Coast South America ($FEU)
 (Source: Xeneta)
Note: While the spot market (Short: Average) has remained comparatively high compared to 2016, the spread between the market high and low, as well as the market high and average, has continued to fall for long-term contracts. Meanwhile, the same spreads in the spot market haven’t reported an equal trend and remain highly volatile month on month.

It Comes Down to Data
It’s not unreasonable to think that the more transparent the trade lane, the less opportunity there is for carriers to penalize or “overcharge” shippers, reflected in Fig 1.
An understanding of how a shipper’s rates have historically compared to the market can be used in conjunction with the latest market data to ensure a fair rate is achieved or maintained.
For example:
1. How have your rates historically compared to the market - do you traditionally pay close to the market high, average, or low?
2. How has the spread (difference) between what you pay, and the market average developed?
3. Are your latest rates consistent compared to the spread you have previously achieved? If it has increased what are the reasons for this and are you no longer receiving a fair deal?
While such questions and data can lead to more informed shippers, the current system of contract negotiations and agreements, particularly in a volatile market, will always result in one side over or under-paying. This, combined with limited or no penalties for contract non-performance creates an ineffective contract for both parties.
Alternatively, in a transparent and commoditized market - why not let the market determine the rate?
We have already discussed that market fundamentals determine the rate and not an individual’s specifications. Therefore, by simply allowing the market (i.e the supply/demand scenario) to determine the rate, pricing can become much more efficient, rather than relying on long-winded negotiations that aren’t worth the paper they’re written on.
One alternative is to move to index-linked pricing, a well-established method in commoditized markets.
Shippers adopting this method in the container market are then free to spend time and resources on improving their supply chains and adding value elsewhere into their business. Meanwhile, for carriers it ensures they receive a fair rate, reducing the likelihood a shipper’s cargo will be rolled if the market spikes.
We mentioned that little has changed in ocean freight contracting in the last decade, however, increased rate transparency is now offering new solutions to those looking for an alternative to the current broken system.