


While tendering for ocean freight, do you often follow short-term market trends to predict long-term market rate movements? In this webinar, Patrik Berglund (CEO and Co-Founder, Xeneta) and Erik Devetak (VP-Product, Xeneta) share insights derived from their data analysis, on how short and long‑term markets move in correlation to each other.
They also elaborate on "Market Liquidity" and why this is a prerequisite to assess if there is a correlation. Get an in-depth correlation analysis for four main corridors - China to North Europe (Import and Export), China to North America West Coast, and North Europe to North America East Coast. Learn how this data can help you devise a data-driven procurement strategy.
Watch the 30-minute webinar HERE
Webinar Transcript:
Patrik Berglund: Welcome everyone to this first webinar of a series that we've branded "The Complete Guide to Ocean Freight Procurement." We're here today to discuss the topic of short‑ and long‑term rates correlating, and with me today I have Erik Devetak, our VP of Products.
Erik Devetak: Pleasure to be here, Patrik.
Patrik: Thanks for joining me. I'm Patrik Berglund. I am the CEO of Xeneta.
We're going to talk about how short and long‑term markets move in correlation to each other.
Erik: We'll have a look, if a movement from the short‑term market influences at all the long‑term markets. If I am a customer of Xeneta that usually trades in the long‑term market, shouldn't it also be following the short‑term market because it's giving me the information of how the next tendering season potentially is going to be.
Patrik: This is interesting to me, because this is something we've kind of always discussed and even before you joined the company. I remember quite vividly that in our first conversations about this, I said, "Just look at the short‑term market where it's trending, and then you will have this indication of whether the long‑term market is going to move," right?
You always challenged that, not saying it was wrong, but no one had really this proof point, maybe like a mathematical approach to this?
Erik: Of course. This is something that I've been hearing for quite a while, and essentially since I joined Xeneta, people are saying the short‑term market predates the long‑term market, but from a mathematical point of view, or for a moment, a linear point of view, we really want to know how long does it predate it for?
We also would like to know potentially, how much information of the next movement in the long‑term market is current? we want to know if there's limitations. Does it work? Does this cause a problem to every single market? Does it not work on some markets? Why does it work in every single market, potentially?
Patrik: Let's pause a bit on that, because I think that's a very important point. One of the things that's been very clear for me in our conversations has been this whole market liquidity phrase. I think for a lot of the listeners and our viewers today, we need to cover that aspect a little bit before we go into the actual content.
Can you tell me a little bit more about what is market liquidity, and is it a prerequisite for these correlations of things?
Erik: The way I would like to look at this is it's a little bit like there's needs to be mass transactions in the market. There needs to be enough group shift in the market and a lot of information in the market in order to possibly translate more of the information flow from the short‑term market to the long‑term market.
If there's a single transaction every six months from anticipated stake holders, then there's going to be not enough knowledge of the market by all the stakeholders in order for the information to flow between the short‑term and the long‑term market.
The way I would like to look at this is, is there enough information from the short‑term to the long‑term markets in order ‑‑ and between them ‑‑ in order for the players of the market to be aware of what is happening in the short‑ and the long‑term markets, potentially.
Patrik: Basically, there needs to be enough container shift, bought and sold, both on the short and the long, on a specific trade for this to be theoretically possible. Is that what you're saying?
Erik: Yes, essentially, but also enough players and not only enough transactions because potentially you can have one person shipping 100,000 containers, and that doesn't really propagate information.
But if there's enough players, if there's enough transactions, if there's enough conversation about this, then of course people start being aware of what's happening, and then of course, we expect to see some form of information going forth into the markets, and therefore some of correlation and therefore, potentially, the short‑term predated the long‑term market.
Patrik: That makes sense to me. The more volume in the players, transactions, and all of that, the more informed, then the more information leaks into the market, and it makes it a bit more liquid. Is that right?
Erik: That's how I would put it.
Patrik: Fantastic. If you look at this agenda for today, you've chosen four corridors that we're going to look at with some more in‑depth analysis. Just to state them now, it's China main ports into North Europe main ports, and then the other way around. You want to comment on those?
Erik: Of course. We started with what was the most transacted market? China main into Northern Europe, it's the biggest intercontinental market in the world. We started to analyze, essentially, what's the simplest case?
It's also a very volatile market. Things can be moving quite a bit on that, for many years now, so it's a very interesting market for us, for all of our customers, and also from a purely analytical perspective.
Then we look at the reverse market, which is also a rather traded market, but a very different market economy in the last years. It was a pretty stable market with one or two shocks ‑‑ very big shocks.
What we tried to see there is, does this concept also work in the less volatile market with more strong shocks?
Patrik: I think that one (China to North Europe) is incredibly interesting to get your point of view on, because as you mentioned, in this one particular movement over a few months last year, where it exploded, right?
Rates completely skyrocketed, and then can we use this line of thinking on the long‑term market for even that corridor, which historically has been very much less volatile, to be honest.
We have China main ports into South America, the East Coast ports as well, and then North America's Southwest Coast, going to China.
Erik: That's correct. After looking at this, two more traded markets, we started testing the boundaries on slightly more deserving ports. We looked here, from China main to South America East Coast, it's still relatively well‑traded, but nothing like the first two, really.
Then we would look at the various trans‑Pacific. It's a very well‑known market, but it's usually more transacted on the opposite side. It's usually more driven prices on this corridor, even though we're doing from China to North America.
We are starting to analyze the reverse, because it's a very asymmetrical market. We might see how it works on that sort of challenge.
Patrik: Very interesting scope. Then we'll wrap it off discussing a bit how these results and the findings can be applied in our actual application, right?
Erik: Of course. With this, it's theoretical work, but the idea also is based on actual values. What we did at the end, once we analyzed and we collected the results, we try to give our customers a way of performance analysis, some way to make the decisions fast.
Patrik: We should look at the first corridor?
Erik: Let's look at it.
Patrik: All right. Let's move to the next slide. This is would be China main port into North European main ports. We got to start discussing the top chart here, and then of course go to the smaller ones. If you take me through the blue and orange line at the top here.
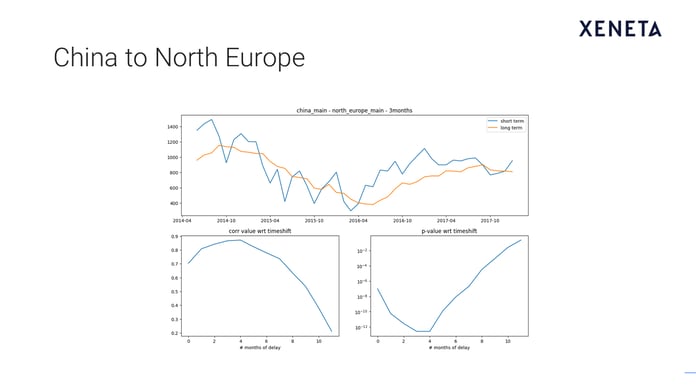
Erik: Absolutely. What we have there is the spot market or the short market in blue, and we have the contract market, or the long market, in orange. What we did is slightly manipulated this data. Not in a bad way, but we tried to take away specific factor matter, and really market for price in the market.
Let me tell you what we did, more specific for the long‑term market. We don't take all the contracts of the valid day, but we only take the contracts that are valid today and have been signed in the last three months.
The simple idea here is that we want to see the short propagating into our long‑term market as quickly as possible. Of course, this is something we also offer to the customer in the application.
Patrik: Hold on. This is analysis, and you go all the way back to 2014 on this corridor, and as you go along on the orange line, you start cutting away the contracts that are old. Every single date equals a maximum of three months back, and then removes the old one‑year contracts, for instance?
Erik: That's correct.
Patrik: What about the short market?
Erik: The short‑term market, very similar concept on the date, but the short‑term market, as you're probably aware, it's very influenced by GRIs, particularly the beginning of the month.
As you also probably know about it, this is ways that less people transact. It's a way that very often can be seen at the beginning of the month, and really, the vast majority of the transactions are at a slightly lower rate, because very often the rate decrease.
What they have done for the short‑term market is really not compare the whole bunch of contracts, it's just the contracts in the last two weeks of the month. What we're trying to achieve there, is cut these high prices where very few people transact with them.
Patrik: Basically, using the end of every month to calculate what's been the average rate of the short‑term market for that month?
Erik: Initially I avoided this for the end of month.
Patrik: Anything else you want to add to top one, or should we bring these small boxes?
Erik: Already, visually, if you look at those lines, you start making assumptions that there is some interplay between the markets today. The idea now is a little bit further from this analysis.
Patrik: Yeah, that's it. What are we looking at, at the bottom left? The correlation value. Explain that one to me.
Erik: Sure. Let's focus on the axis of that graph at the beginning. On the vertical axis, you have effectively the correlation between the two markets. What do we mean by correlation? It's really how much of the shift coming in the long‑term market could potentially be explained by the short‑term market.
A 0.7 percent relation, it's in a way, lies at 70 percent of the shift. It hasn't, or potentially as I explained very close for the short‑term market. We have made the statement that they don't correlate immediately, that there might be some time delay. On the horizontal axis, what we see is the time delay. How did the correlation develop in the time delay?
Is it immediately that the long‑term market move, or does the movement of the short‑term market propagate two or three months later? What you can see here very quickly, is that it takes up to three or four months for the short‑term markets information to propagate with the long‑term market.
Patrik: Would you tie that to the fact that there's a lot of tenders RFQs done on the shippers' side on a quarterly basis? They have this tendency to aspire to coordinate the different waters of the earth.
Erik: Potentially. There is definitely a statement to be made that while people transact on the spot market much more on a monthly basis, if not more often, but people transact on the contracted rates of the market, much more on a quarterly or annually basis.
Definitely also is the case, but it takes at least up to a month for information to flow from one market to the other one, because otherwise you expect this peak to be free, while we see the fourth month also being very highly correlated.
Let's also focus on the various results in what we can see here is that the two markets are actually very similar, right? A movement of the short market potentially spends up to 90 percent of the future movements in the short term market.
Patrik: Yes. It's very high result, but 90 percent of that...
Erik: Yeah. It isn't surprising at all for this market, but as I said, this is a market that everybody is aware of in many ways, so we expect the best results in this market.
Patrik: Good point. That says then to me that there is a degree of correlation between the short and the long wait between this two to four moths time period. Then, if we go to other chart on the bottom right side, what's this T value?
Erik: That's literally a measure of how confident we are for the result, how confident that this is not simply a fluke because of limited amount of data, because of other factors potentially. What we say here, it's any value below 10^‑5, which is approximately here, it's highly unlikely to be a fluke.
It's really almost impossible that this is just a piece of data, rather than, there seems to be something real going on. What is very interesting is we are fairly confident up to six months that the short‑term market has some information about the longer market, although the amount of information it has is limited.
After six months, we become less and less confident because essentially a surge of other factors potentially come into place.
Patrik: The short‑term market keeps moving, right? It's important, if I get this correctly then to keep track of what's the trend of the last two to four months on the short term, to have some kind of level of education on what we expect to happen on the long term.
Erik: Essentially what this says is that if I'm a customer mainly transacted in the long term, I should be pretty aware of where the short‑term market is and was three, four months ago because that effectively drives the long‑term market.
At least, it's difficult to predict the future. That's, at least the behavior you can see in the past, not of course a guarantee that these behaviors will be identical in the future.
Patrik: I think that's a very important point to make but I think to me it's more like, this then, you can make a more than a qualified guess about where the market is most likely to move, right?
Erik: Of course.
Patrik: Fantastic. We're going to use the same structure for the other corridors but now we've covered the basic that you can see how the data is picked and worked on the top one and how the market has actually moved, both on short and long.
Then you have the percentages of correlation on the bottom left and then this bottom right would be, how confident can we be on that correlation?
Erik: That's perfect.
Patrik: Fantastic. Let's move onto the next corridor, then, which is the other direction, north Europe main ports going to China main ports. Same data selection but here you have this rocket ship of movement that is on the short‑term market last year, which I know a lot of our customers struggle with and a lot of companies had to move away from their long‑term contracts into the short‑term.
Market data became very essential , of course. If you've had a long‑term contract expiring in that period, this would actually be quite valuable information.
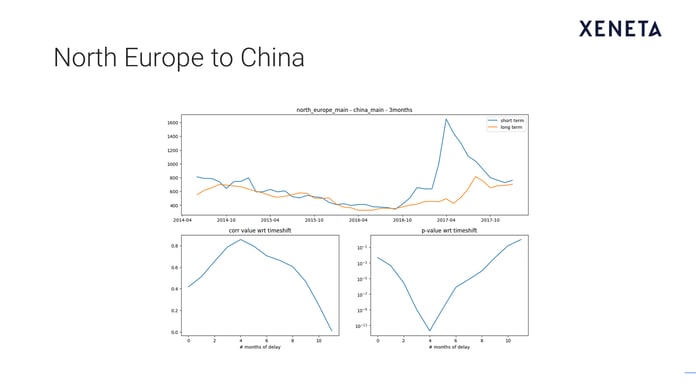
Erik: Yes, it's very interesting because if you monitor the market just a few months before, even in the beginning of 2017 period, you already saw an almost abnormal movement of the short‑term markets. You saw something was going on. Then, closer to the date of the event, towards the end of February, beginning of March, you can see a very high peak here.
You can see that the short‑term market moved fast. This took a while to propagate into the long‑term market because of this seasonal concept and also because your first point, it probably hit you so hard if you have implementation problems with the short‑term market potentially, rather than your most valued customers very often.
In principle from a very generic point of view, we have a very similar concept. Here, three to four months, of course, slightly less trade at the corridor, slightly worse correlation, slightly less information propagated within the markets, which is exactly what we'd expect.
Again, very slow confidence level but, again, less confident in the market potentially but still very, very confident in the two to four, five months basis and then going less and less.
Patrik: That pattern, you can actually see very clearly just using your eyes when that market event happened, right?
Erik: Of course.
Erik: The idea of the mathematical analysis is that we propagate that concept and really see that, even with the smaller movements, potentially picked, you see the pattern there. What seems to be the case is these generic reasons for these corridors...
Patrik: Very good. Let's move onto the next corridor, which would be China main to South America east coast. I think this is interesting, this corridor because it's not that well‑covered in the mainstream media but it's by far the most volatile corridor that I've seen over the past few years.
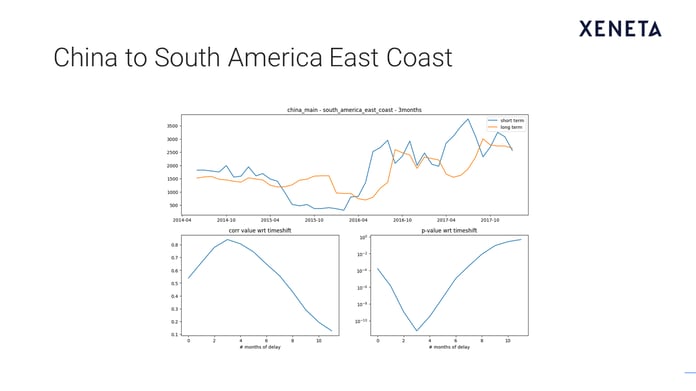 We've seen some absurd low rates, only for it to explode and go very high on the short‑term market as well as the long‑term market. To me, just using my eyes on this top one, I can still take some output out of it that comes but it becomes a bit more complicated just assuming the correlation there.
Erik: Of course, but as you can see from the results, we are able to see very similar ideas. Three to four months ahead, there's correlation. We can see very similar ideas in the confidence.
Even this volatile market, actually even more in this volatile market, having an idea, monitoring the short market of the contracted rates, it's important because the risk of the market share jumping by a thousand seems to be much higher here and so we move onto negotiations for the end of year contract, knowing where this market is in the short term, might be very important for you.
Patrik: Also, to use the short‑term data here to actually make a judgment on whether it's a good time to go to market when it's so volatile is actually a value.
Erik: If you have the option to potentially prolong your rates or if you have an option of re‑shaping the rates, then, of course you have more flexibility of what you're doing and therefore, the short‑term market can even more help you with the decision‑making process.
Patrik: We have one more corridor that we're going to look at today, which would be this one. North America south west coast to China main ports. This looks very different.
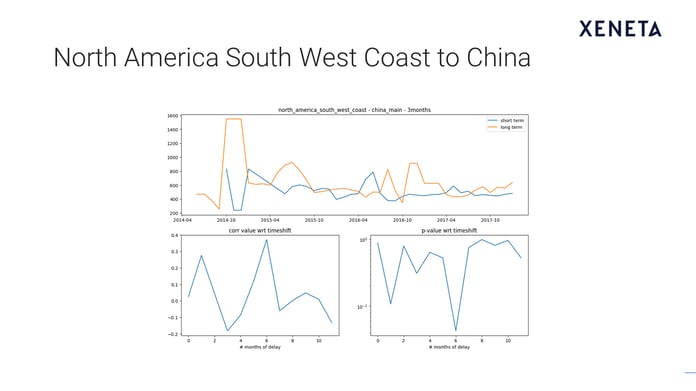 Erik: It does. When you have an analysis like this, it's always important to be aware of the limitations of what you're doing. This could be a limitation in such an analysis, right? For example, what we're seeing here is that we, at least on this market, the structure of the market, and maybe the amount of trade.
It might be the fact that it's a very asymmetric trade where the prices are potentially mainly at a profit, so the currents might potentially mainly being driven on the other leg of the trade.
There's many reasons why this might be the case, but we're looking at them from many perspectives. What we see here, it's the same approach yield essentially no result. What we see here on the bottom left, it's the correlation. It's all over the place.
What we see on the bottom right, it's on no time level delay, we have a probability of less than 1 in 15, or 1 in 16, of this being a pure fluke which is simply not good enough on the current condition, or any in such market.
Patrik: This point takes us back to this whole liquidity discussion we had at the beginning. One minus that makes it that, it's too little trade. There's not enough volumes being moved. There's not enough potential players on it. There's not enough information floating in that market for this kind of correlation to happen.
For our customers and users, this would be incredibly important, because we're saying here that you can't use the short‑term market to make assumptions about the way the long‑term market would move.
Erik: That's right. It's very clear that here you cannot make any assumptions. You don't know how it's going to be in the future, but in the past if you did that assumption, it had no value but a random mess. Liquidity is potentially is part of problems here, while it's important.
This side there is an early potential issue, that we're investigating. It might be trade asymmetry trade in the past, it might be different ways of procuring. There's a lot of issues here, but these are possible factors that contribute to this not working the same way as we can see today.
Patrik: I think in terms of this correlation part, I think it's fine with these charts. I suggest we take a look at the actual application and see how this can be the way of thinking. How can that be carried with reviewing the market movements in our actual applications.
What I'll include up here is China main, going to north European main, which is the first one we put back with your analysis. What would you say is important for me to have in mind? This is a three‑year historical development, and we're showing the market outreach for the short‑term in orange, and blue one in long and also into the future.
Can we spend a little bit time in this? How do you recommend me to think when looking at this data?
Erik: Absolutely. What we very clearly see, it's in this data set what we said before, April 2000 if you're going towards July or August 2016. We already see a very clear pattern on the short‑term market, of increasing the prices, which we think they'll use as a signal that potentially the long‑term market is also unaffordable.
See very clearly that the long‑term market is not affordable, it has followed pretty quickly, actually. What we can see here, it's also a drop that happens towards the beginning of 2018. This seems to be propagating potentially towards March, April.
Patrik: This is important, because now when we look at March, even all the way until May here, we still using that three‑month methodology. Whatever values you have this far right here, is basically contracts that's just being negotiated. That dip that you see on the short‑term market a few months before, it's also what we're starting to see on the long.
Then, this is what's interesting, because the short‑term market might seem to pick up again, and if that continues, tendering now might have been a very good decision.
Erik: Yes. Of course, as I said it's very difficult to talk of the future, but if I look at this as an indicator of where the long‑term market might be going, it really does in the case of tendering right now, might have been a very good choice.
Patrik: To me it’s more about having that data behind making those decisions? Because I think for procurement professionals by making a call at some point, rather than the more you can empower them with that data to make the argument that that's the reason why we make that qualified decision, rather than just saying, "We're going to do it like we've always done." Right?
Erik: The way I see it, it's a way of discussing the market with even the customers to understand where the market is, often the short and long, to understand how potentially the short is running into the long‑term market ‑‑ contact with market ‑‑ and to have a very frank discussion of where the markets are, and what potentially can happen in the future.
Patrik: Include the actual suppliers in these conversations, and I know that a lot of our customers have also raised different topics out of this. They've always done an annual contract, now they try to get these quarterly reviews, because there's uncertainty in the market, and one has some kind of toolbox available that really goes way off to what they secured, maybe they can go back to the table during the contract period.
That also is potentially giving the suppliers some benefits, which from my point of view, when we have a relationship and partnership, it sounds completely fair.
Erik: What we're trying to do as for transparency throughout the data in the discussion, and we just gave you one more tool for the transparency, and for a data‑driven discussion.
Patrik: That it. Thanks, Erik. Is there any final comments you would want to add, or should we perhaps leave it with that?
Erik: Really, Patrik, it's been a pleasure being here with you, and hopefully also our customers enjoyed the webinar. Thank you all for joining us, then.
Patrik: Fantastic. I was mentioning this was the first webinar in a series of additional webinars that will come in the next few months within the category of the complete procurement. Thank you.
Erik: Thank you.
If you missed any our webinars – or simply want to refresh your memory – you can access all of them on-demand here.


