<img height="1" width="1" style="display:none;" alt="" src="https://dc.ads.linkedin.com/collect/?pid=248564&amp;fmt=gif">
REQUEST DEMO
See Xeneta in action
Learn more about the platform in your own way.
demo-demo
Customized Demonstration

Schedule a personalized demo of the Xeneta platform tailored to match your container shipping and air cargo procurement strategy.
Schedule Now
demo-network
Live Group Product Tour

Shed light on the volatile container shipping and air cargo market with real-time, neutral freight rate data. Join our weekly LIVE 15-minute group demo to see for yourself.
Sign up Here
here. 

" >
here. 

" data-form-redirect="https://www.xeneta.com/xeneta-live-group-demo-thank-you-" >

XSI® Public Indices Reports

Ocean Freight Long-Term Contract Market

May 2023 Issue

May 2023 witnessed an unprecedented decline in container rates, as the global Xeneta Shipping Index (XSI®) recorded its largest-ever month-on-month drop of 27.5%. This slump marks the ninth consecutive month of rate decreases, resulting in the lowest XSI® level since October 2021

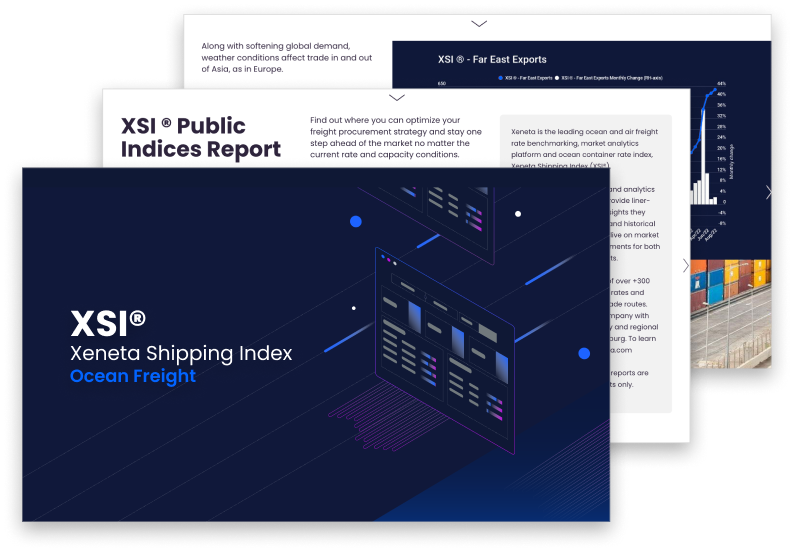
XSI® Public Indices Content

The monthly XSI® Public Indices report gives an indication of the global market movements in the container shipping industry focusing on the long-term market for the biggest regions in the world:

  • Global index
  • Far East indices (import/export)
  • Europe indices (import/export)
  • US Indices (import/export)


Methodology

  • Rates pulled from Xeneta’s ocean freight platform of +300m contracted rates
  • Rates delivered from freight forwarders and shippers
  • Based on long-term contracts only - contracts valid more than 88 days
  • Indices based on an aggregation of trade-weighted corridors
  • Indices rates surcharges are based on all-in CY/CY pricing methodology
  • Global index is a combination of worldwide trade-weighted corridors not limited to US, Europe and Far East indices