-1.jpg)

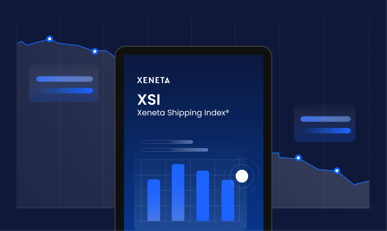
The global XSI® rose again in July to 435.2 points, making it the fifth month in a row that has hit a new record high. According to the latest Xeneta Shipping Index (XSI®), today’s valid long-term agreements stand 112% higher than this time last year and a massive 280% up against July 2019.
Despite the indications that we may have reached a peak and that prices of new agreements are more likely to hold than suddenly leap up again, there is little comfort for shippers that have been continually battered by a market in overdrive and seeing prices stabilizing at historically high levels.
“The carriers have enjoyed staggering rates rises, driven by factors such as strong demand, a lack of equipment, congestion and COVID uncertainty, for 17 of the last 19 months,” comments Xeneta CEO Patrik Berglund.
“July has seen yet more upticks across the board, but the signs are clear there is a ‘shift’ in sentiment as some fundamentals evolve.”
Xeneta CEO also notes that July’s increases are the slowest since January, with upward pressure on long-term agreements easing as spot rates fall across major trades. In addition, volumes on many corridors are down, with, for example, containerized European imports falling by 3% and exports 6% in the first five months of 2022.
XSI® - US Imports/Exports
The XSI® index for US imports rose by 5.9% to 533.39 points. This is up 173% from July 2021, but a considerably smaller increase than just two months ago, when the index rose by 65% month-on-month. A slower index growth reflects stable contract rates and tender seasonality as only a few contracts with lower rates are left from H1 2021.
XSI® - Europe Imports/Exports
European imports on the XSI® also continued to grow, but at a much slower rate than in the past five months. The index rose by 1.9% in July, reaching a yet-another record high of 439.26 points. Compared to the end of 2021, this is a 62% increase. The exports index rose month-on-month by 3.9% to 368.53 points. This brings the year-to-date growth in the index to 92%.
XSI - Far East Imports/Exports
The Far East export index rose 2% in July to 618.03 points. It’s another index recording a slowdown in the month-on-month index growth yet still posting a new record high. The index is up by 150% compared to a year ago and by 85% since the end of 2021. On the import side, the XSI® index rose to 220.68 points in July, 1.1% higher than the last month. This index has risen by 53% from July 2021 and 35% from the end of 2021.

Note: Xeneta's XSI® is compiled from the very latest crowd-sourced ocean freight rate data aggregated worldwide. Companies participating in the benchmarking and market analytics platform include names such as ABB, Electrolux, Continental, Unilever, Nestle, L'Oréal, Thyssenkrupp, Volvo Group and John Deere, amongst others.
Want to learn more?
Watch our latest State of the Market webinar to review short- and long-term market changes to understand larger trends and pull actionable insight.