-1.jpg)
The September 2019 Xeneta Shipping Index public update and commentary on the long-term market is now available. Here is a snippet of how that market has moved so far in September 2019 on the main trade corridors.
You can find an excerpt of the report below. Get the full September 2019 XSI® report (PDF) with all graphs here.
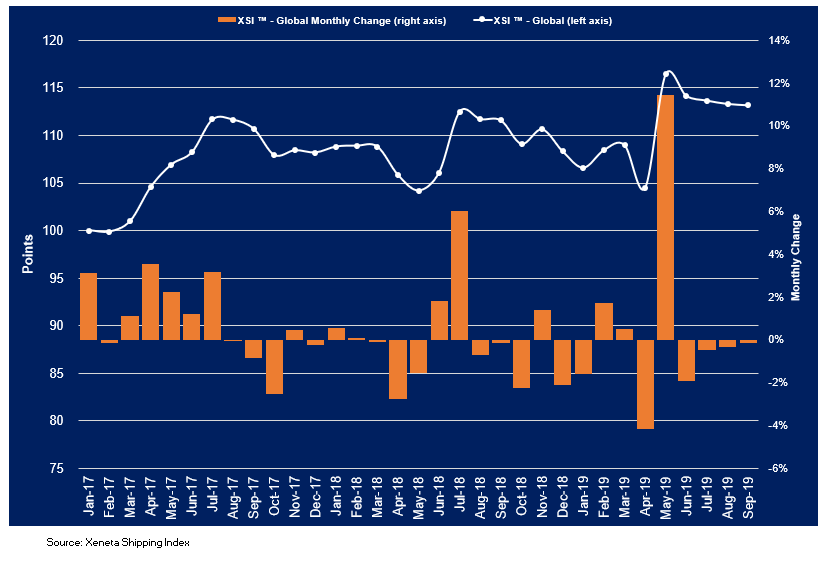
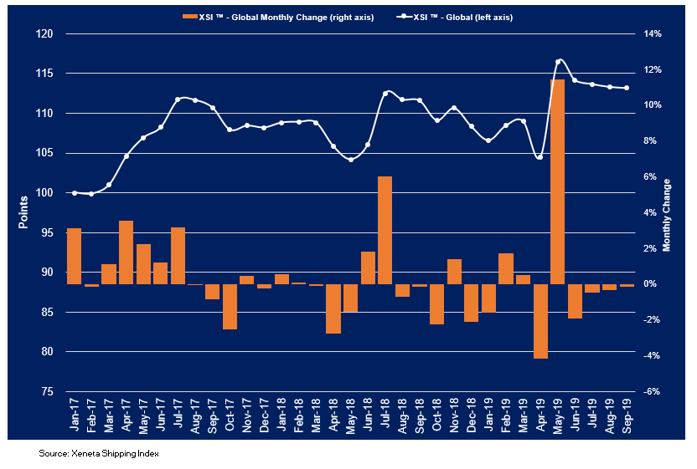
The global XSI® fell by 0.1% in Sep-19 to 113.18 points and is now 2.8% lower than the level reported in May-19. Despite the most recent decline, the benchmark remains up 1.4% compared to the equivalent period of 2018 and it has increased by 4.5% since the end of 2018.
In other news, Evergreen has pushed forward with an order for ten 23,000 TEU vessels that will mean the number of ULCVs consisting of 18,000 TEU or more in the Ocean Alliance will be closely aligned to the number operated by the 2M alliance. The order was confirmed in a recent stock market disclosure, with each vessel costing around $150m. Worryingly for carriers in THE Alliance, even with the inclusion of HMM, they will lag well behind their competition in terms of number of ULCVs available. While the benefits of lower unit costs are dependent on utilization rates, in commoditized markets where the lowest slot cost wins, it could make a challenging market even more difficult for members of THE Alliance. This could be exacerbated even further as the market transfers to more expensive 0.5% LSFO.
XSI® - Europe Imports / Exports
European imports on the XSI® recovered some of the lost ground reported last month, increasing by 0.2% month-on-month to 111.58. The index is now up 2.5% since Sep-18 and has risen 2.0% since the end of last year. Developments in European exports were less positive, with the index declining by 1.1% since last month to 114.08 points. However, European exports remain 4.2% higher than in the same period of 2018 and are up 3.5% since the end of 2018.
XSI® - Far East Imports / Exports
Imports on the Far East XSI® declined by 0.8% in Sep-19 to 98.27 having now declined for three consecutive months. Year-on-year the index is down 17.2%, with the benchmark having fallen by 13.3% since the end of last year. While there was an improvement in Far Exports, the XSI ® edged up just 0.3% month-on-month to 122.12 points. Despite this slight improvement it remains 0.7% lower than Sep-18 but has increased by 5.1% since the end of 2018.
XSI® - US Imports / Exports
US imports on the XSI® rose by just 0.3% in September to 122.20 points but has been steadily increasing since the jump reported back in May. As a result, the benchmark is now up 13.2% compared to the equivalent period of 2018 and has risen 20.3% since the end of last year.
Don't miss out! Get your copy of the full September 2019 XSI report (PDF) with all graphs now. Xeneta Shipping Index Public .
MEDIA: Please take a look at our recent press releases.