Welcome to the summary of the May 2020 edition of the Xeneta Shipping Index (XSI) for the long-term container market. Here is a snippet of how the long-term container market has adjusted to that new normal in May 2020.
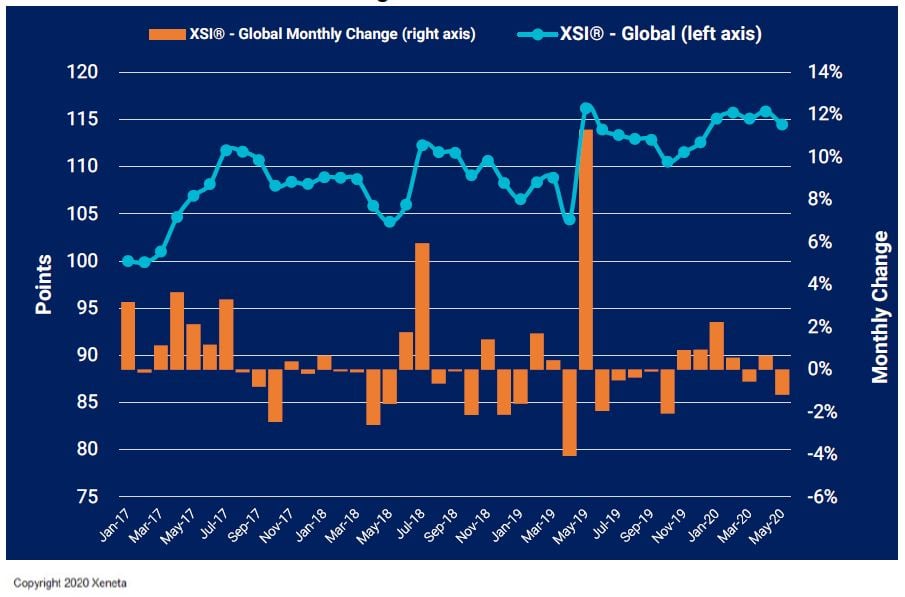
According to the latest report from Xeneta, the global XSI® declined by 1.2% in May-20 to 114.47 points. Although year-to-date the index is still up 1.7%, it is 1.5% lower than the equivalent period of 2019.
XSI® - Europe Imports / Exports
Imports on the European XSI® continued to decline in May-20, falling by 2.0% to 112.64. This marks the third consecutive month-on-month fall for the index, with the benchmark down 2.2% year-to-date and 6.2% lower than in Feb-20. Despite the declines, the benchmark is still 3.6% higher than in the same period of 2019. More positively, exports on the XSI® reached a new all-time high after increasing by 0.8% in May-20 to 121.36 points. Unlike imports, exports have maintained their upward momentum and have risen by 6.1% since the end of 2019 and by 8.8% since Oct-19. Meanwhile, year-on-year the benchmark is 5.7% higher.
XSI® - Far East Imports / Exports
Far East imports on the XSI® climbed by 3.9% in May-20 to 104.51 points. Since reaching its all-time low of 93.83 in Oct-19, the benchmark has risen by 11.4%. Year-on-year the index is 7.9% higher and has increased by 6.0% since the end of 2019. Exports have continued to slide, falling by 1.4% month-on-month to 120.66. Whilst the index is still 1.7% higher than in Dec-19, it is down 6.1% compared to the equivalent period of 2019.
XSI® - US Imports / Exports
US imports on the XSI® declined in May-20 by 1.5% to 127.28 after reaching a new all-time high in the previous month. Despite the month-on-month fall, the index remains 10.4% higher than the same period of 2019 and has risen by 1.8% since the end of last year. Meanwhile, exports fell by 3.4% to 96.08, more than offsetting the increase reported in the previous month. Year-on-year the benchmark is still 1.6% higher and is up 0.2% since the end of 2019.
Read the full the full May 2020 XSI report (PDF) with all the market movement graphs now. Xeneta Shipping Index Public .
MEDIA: Please have a look at the press release here.
---
.png)


-1.jpg)


