-1.jpg)

The May 2019 Xeneta Shipping Index public update and commentary on the long-term market is now available. Here is a snippet of how that market has moved so far in May on the main trade corridors.
Excerpt below. Get the full May 2019 XSI® report (PDF) with all graphs here.
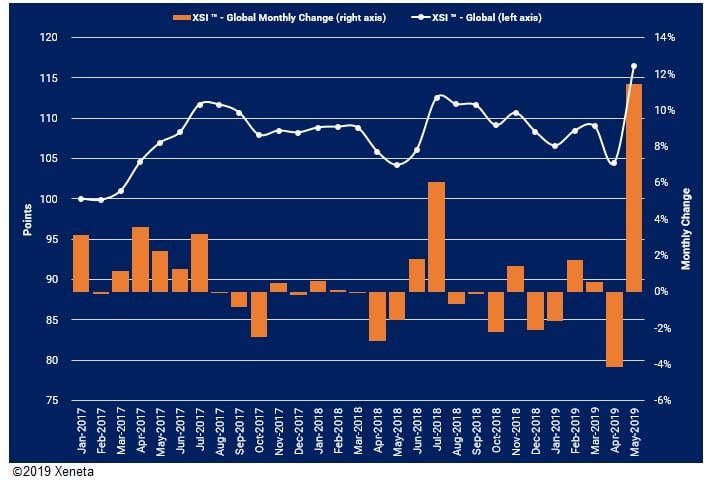
The global XSI® jumped by 11.5% in May-19 to 116.43 points, thereby reaching a new all-time high for the index. The month-on-month increase represents the single largest gain reported by the benchmark since its inception and follows on from a decline of more than 4.0% reported in the previous month.
XSI® - Europe Imports / Exports
Imports on the XSI® increased by 1.7% in May-19 to 108.69 points, partially offsetting the decline of 4.8% reported in the previous month. The benchmark is now 11.4% higher than May-18 but it is down 0.7% since the end of 2018.
Meanwhile, European exports on the XSI® increased by 6.7% to 114.81 points. This represents the single largest increase in the index since Jul-17 when it jumped by 9.4% month-on-month.
XSI® - Far East Imports / Exports
The Far East imports section of the XSI® declined by 14.2% month-on-month to 96.85 points. This represents the largest ever monthly decline for Far East imports and is significantly lower than the previous record of -6.2% recorded in Jul-18. As a result of this decline, the benchmark is now 17.2% lower year-on-year and is down 14.6% since Dec-18.
In complete contrast to imports, the Far East exports benchmark on the XSI® jumped by a massive 15.9% to 128.53, representing a new all-time high for the index
XSI® - US Imports / Exports
In May-19 the XSI® reported an 18.8% month-on-month increase in US imports to 115.28 points. This is significantly higher than any previous monthly increase and takes the benchmark to a new all-time high.
US exports on the XSI® increased by 1.5% to 94.54 points having posted a month-on-month decline in Apr-19. Despite posting minimal growth in May-19, the benchmark is 13.2% higher than the same period of 2018 and it is up 8.0% since Dec-18.
Don't miss out! Get your copy of the full May 2019 XSI report (PDF) with all graphs now. Xeneta Shipping Index Public .