-1.jpg)
Welcome to the summary of the March 2020 edition of the Xeneta Shipping Index (XSI) for the long-term container market. March has been a perilous month for the industry and the world. We are all getting used to a new pace of life, new ways of working, new ways of keeping ourselves and family safe, ultimately, accepting and adjusting to the new normal. Here is a snippet of how the long-term container market has adjusted to that new normal in March 2020.
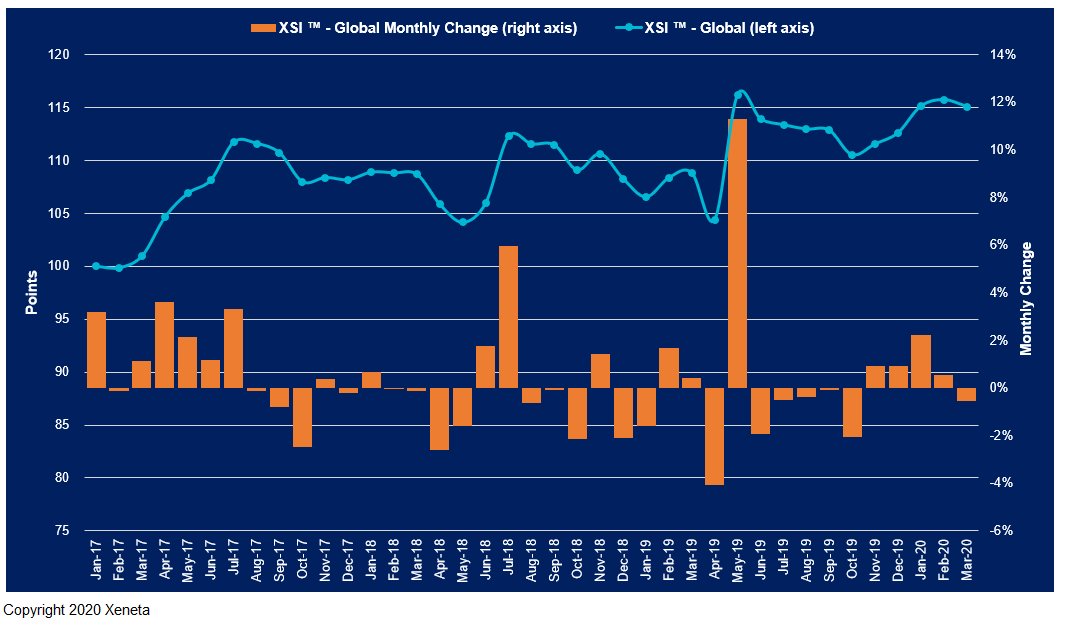
According to the latest XSI® Public Indices report from Xeneta, March 2020 saw a small dip of 0.5% in rates after a sustained period of growth for the XSI global index. Although these symptoms look mild, the future is characterized by growing uncertainty, with widespread economic disruption and looming global recession likely to impact on demand across all key trading routes.
XSI® - Europe Imports / Exports
Imports on the European XSI® fell by 1.0% in March to 118.85 points. This follows on from a steady rise in the index, which saw it reach an all-time high of 120.4 points last month. More positively, European exports on the XSI ®increased by 0.5% in Mar-20 to 117.00 points.
While there was hope that the key Far East - North Europe trade would witness a rapid recovery once Chinese factories were back up and running, it has become clear this is unlikely to materialize.

XSI® - Far East Imports / Exports
Far East imports on the XSI ®increased by 0.4% in Mar-20 to 101.97. However, the index is still 11.6% lower than the same period of 2019, albeit it is up 3.4% since Dec-19. Far East exports declined in March, falling by 0.8% to 122.31 points. Despite the decline, the benchmark remains higher than the start of the year and is up 6.4% compared to the equivalent period of 2019. Since the end of last year, it has increased by 3.1%.
XSI® - US Imports / Exports
US imports on the XSI ®increased by 1.3% month-on-month to 123.60 points, thereby reversing the small decline reported in the previous month. Year-on-year US imports are up 23.1%, but the index has declined by 1.1% since the end of 2019 when it reached an all-time high. Meanwhile, US exports declined by 2.3% in Mar-20 to 97.55, with the index unable to maintain the upward momentum witnessed at the end of 2019.
With Coronavirus now taking hold in the US, the outlook for consumer spending looks grim.
Read the full the full March 2020 XSI report (PDF) with all the market movement graphs now. Xeneta Shipping Index Public .
MEDIA: Please have a look at the press release here.
---