-1.jpg)
The July 2019 Xeneta Shipping Index public update and commentary on the long-term market is now available. Here is a snippet of how that market has moved so far in July on the main trade corridors.
Excerpt below. Get the full July 2019 XSI® report (PDF) with all graphs here.
The global XSI® declined by 0.4% in July to 113.67 points and has now fallen by 2.4% since its all-time high of 116.43 recorded in May this year.
Despite this month-on-month fall, the benchmark is still 1.0% higher than the equivalent period of 2018 and is up 4.9% since the end of 2018.
July saw a marginal decline in rates of 0.4%, with a marked fall in the Far East export benchmark. Meanwhile US exports and European imports performed well.
XSI® - Europe Imports / Exports
European imports on the XSI® increased by 5.7% in Jul-19 to 112.95, representing a new all-time high for the index. Meanwhile, exports on the index rose by just 0.7% to 114.72. However, it remains at a comparatively high level and is up 4.0% since the end of 2018 and is 1.5% higher than the level recorded in Jul-18.
Carrier rate increase announcements have been issued and are aligned with several blanked sailings occurring this month and in the first few weeks of August, as carriers take action to compensate for the poor demand-supply fundamentals.
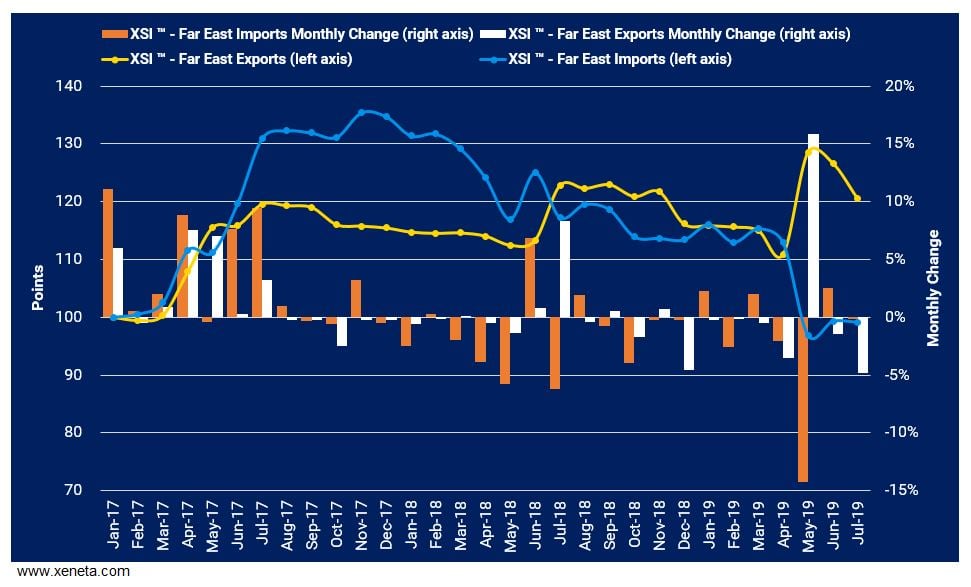
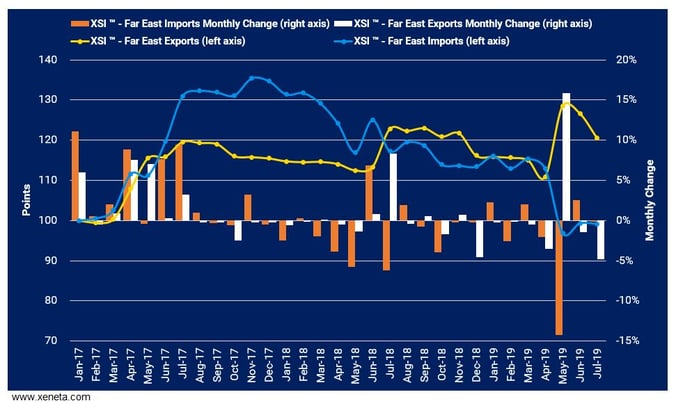
XSI® - Far East Imports / Exports
Imports on the Far East XSI® continue to stumble, with the index down 0.1% since last month to 99.14 and therefore below the level recorded when it was first incepted back in 2017. Meanwhile, Far East exports on the XSI® also declined in Jul-19, falling by 4.8% to 120.55.
In signs that the ongoing trade war with America is having an impact on volumes, China reported economic growth of 6.2% in the second quarter of 2019.
XSI® - US Imports / Exports
Imports on the US XSI® continued to reach new heights, increasing by 2.9% in July to 121.74 points. The benchmark has now increased by 19.8% since the end of last year and is up 12.0% year-on-year. Meanwhile, US exports on the XSI® also rose month-on-month, increasing by 6.6% to 97.03.
Recently released data shows US ports are also feeling the impact of the trade war, with the largest reporting a year-on-year decline in throughput during June of 3.3%.
Don't miss out! Get your copy of the full July 2019 XSI report (PDF) with all graphs now. Xeneta Shipping Index Public .