
The June 2019 Xeneta Shipping Index public update and commentary on the long-term market is now available. Here is a snippet of how that market has moved so far in June on the main trade corridors.
Excerpt below. Get the full June 2019 XSI® report (PDF) with all graphs here.
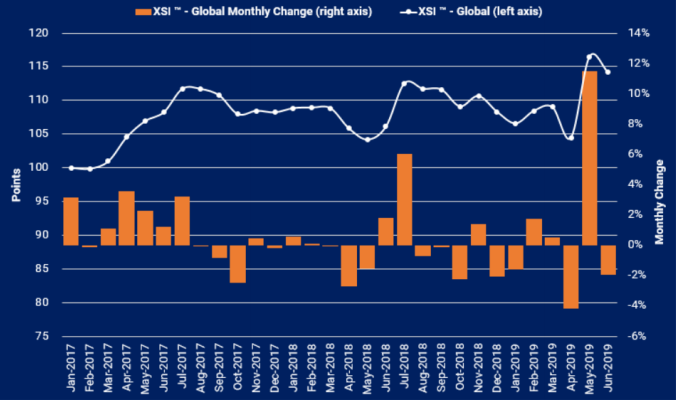
The global XSI® declined by 1.9% in Jun-19 to 114.18 points, having increased by almost 12% in the previous month. Despite this month-on-month decline, the index is still 7.6% higher than the same period of last year, thanks primarily to the jump witnessed in May. It also means the XSI is 5.4% higher than at the end of 2018.
XSI® - Europe Imports / Exports
European imports on the XSI® fell by 1.7% in June to 106.83 points, thereby reversing the increase reported in May. Year-on-year the benchmark is 8.0% higher than the equivalent period of 2018 but it is 2.4% lower than the end of last year.
Meanwhile, exports on the index declined by 0.8% to 113.92 points in Jun-19. The benchmark is still at a comparatively high level and is 5.0% higher than Jun-18. Since the end of 2018, it has increased by 3.3%, although this is entirely attributed to the jump reported in May.
XSI® - Far East Imports / Exports
Imports on the Far East element of the XSI® regained some of the ground lost last month, increasing by 2.5% month-on-month in Jun-19 to 99.29 points.
Despite this increase, the benchmark is still 20.6% lower than the same period of 2018 and it has fallen 12.4% since the end of last year.
XSI® - US Imports / Exports
Imports on the US XSI® have continued to climb, rising by 2.7% month-on-month to 118.35 points. This represents another all-time high for the benchmark having increased significantly in May. Compared to Jun-18 it is up 17.2% and it has risen 16.5% since the end of last year.
Meanwhile, US exports on the XSI® declined by 3.7% in Jun-19 to 91.06 points. While the index is still below the level at which it was first incepted, it is up 3.2% year-on-year and has risen by 4.0% since the end of 2018.
Don't miss out! Get your copy of the full June 2019 XSI report (PDF) with all graphs now. Xeneta Shipping Index Public .