-1.jpg)
Welcome to the summary of the July 2020 edition of the Xeneta Shipping Index (XSI®) for the long-term container market. Here is a snippet of how the long-term container market has moved despite the severity of the Coronavirus pandemic.
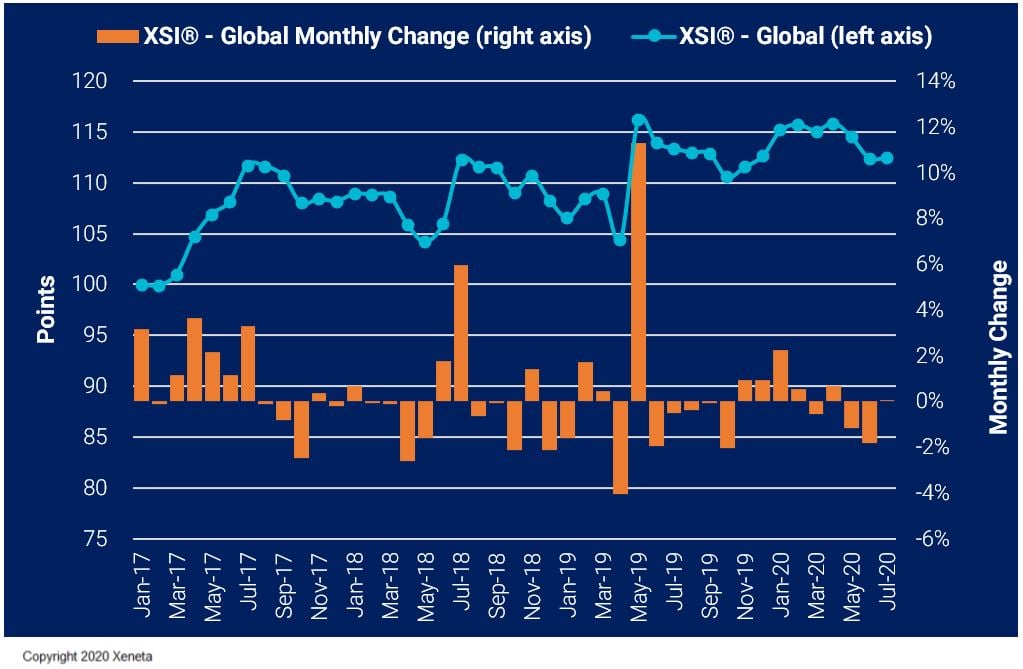
According to the latest report from Xeneta, the global XSI® increased by just 0.1% in Jul-20 to 112.45 points. The index, therefore, remains 3.2% below the all-time high of 116.19 reported in May-19. While the benchmark marginally increased in July, it remains down 0.8% year-on-year and is 0.1% lower than at the end of 2019.
Xeneta CEO, Patrik Berglund, attributes the relatively minor movements to the proactivity of owners, as they continue to perform a “delicate balancing act” with supply and demand.
XSI® - Europe Imports / Exports
Imports on the European XSI® increased by just 0.2% in Jul-20 to 110.72 points, having declined for the previous four months. Compared to the equivalent period of 2019 the index is 2.0% lower and has fallen by 3.8% since the end of last year. Developments in European exports were less favorable, with the benchmark falling by 2.0% to 118.58. This represents the largest month-on-month decline since Oct-19 when it fell by 2.3%.
XSI® - Far East Imports / Exports
Far East imports on the XSI® fell by 4.5% in Jul-20 to 100.76 points, thereby reversing the small increase reported in the previous month. Despite the month-on-month decline, the index remains up 1.6% year-on-year and has increased by 2.2% since the end of 2019.
Governments and companies have been keeping a close eye on China to see if developments there can help provide any indication as to the speed of the economic recovery.
XSI® - US Imports / Exports
US imports on the XSI® declined marginally in Jul-20, falling by 0.1% to 121.28 points. Since the all-time high of 129.20 reported in Apr-20, the benchmark has declined by 6.1%. Year-on-year it has fallen by 0.4% and it is 3.0% lower than Dec-19. Meanwhile, US exports rose by 1.2% in Jul-20 to 93.81 having declined for the previous two months.
With Chinese tensions showing no signs of improvement
and the pandemic still ravaging the US, demand is likely to remain subdued and therefore carriers will no doubt have to withdraw capacity once more if they are to sustain rates at a
reasonable level.
Read the full the full July 2020 XSI report (PDF) with all the market movement graphs now. Xeneta Shipping Index Public .
MEDIA: Please have a look at the press release here.
---