-1.jpg)
Just in time for the holidays, our gift to you is the December 2018 Xeneta Shipping Index update and commentary on the long-term market. Here is a snippet of how that market has moved so far in December on the main trade corridors. Happy holidays from Xeneta to you and yours.
Excerpt below. Get the full Dec 2018 XSI report (PDF) with all graphs here.
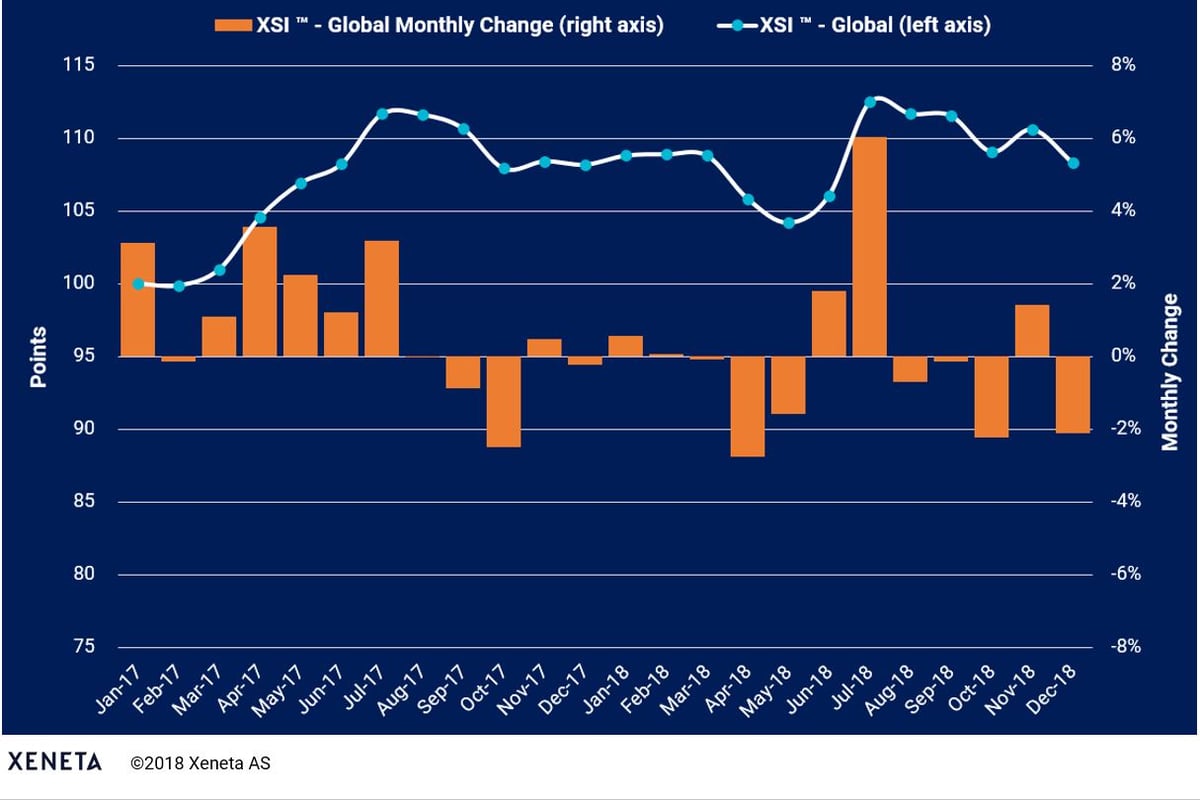
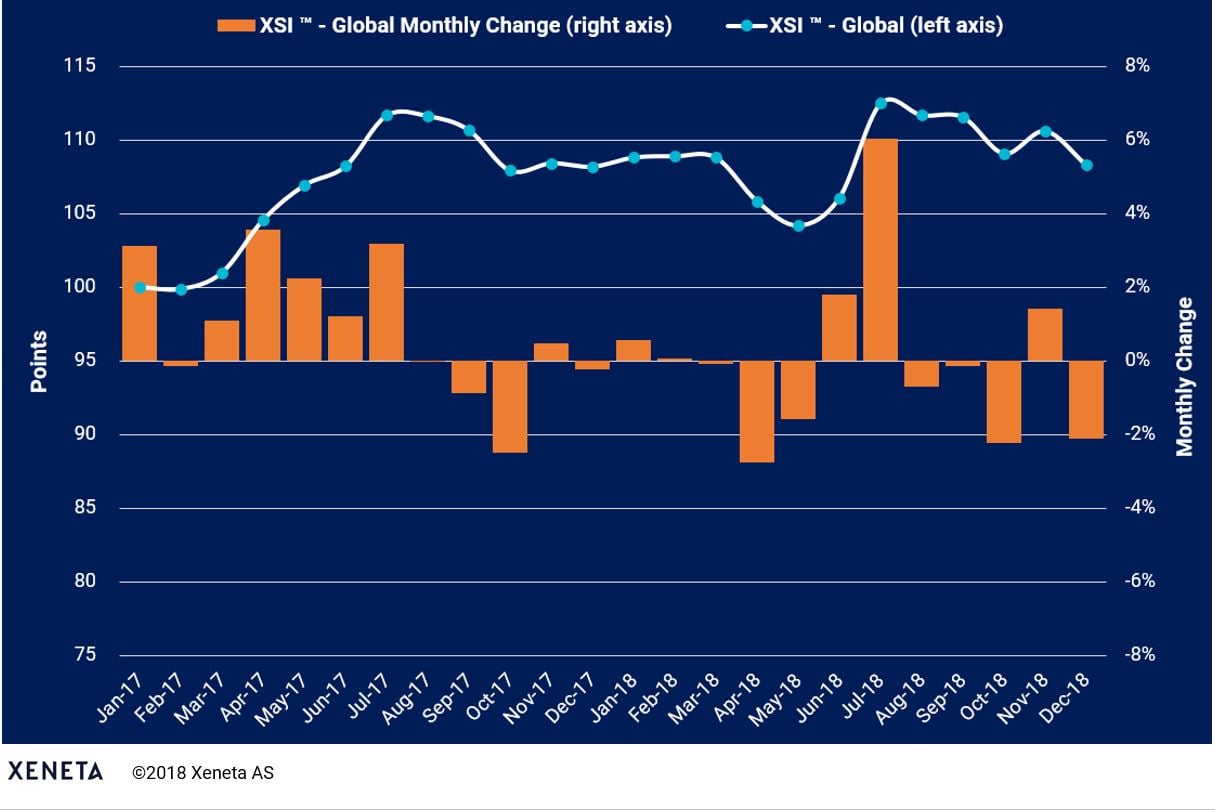
XSI ™ - Global Index
The XSI ™ Global benchmark declined 2.1% in December to 108.31 points, having increased by 1.4% in Nov-18.
The fall coincides with the traditional slowdown recorded for this time of the year and reflects declines seen on some of the major trades. However, despite the fall, the index is still at a similar level (+0.1%) to that recorded at the same period of last year. Year-to-date the benchmark is 0.5% lower, having failed to meaningfully reverse the downward trend reported since the summer.
XSI ™ - Europe Imports / Exports Indices
European imports on the XSI ™ fell 1.1% in Dec-18 to 109.36 points. However, the index is still 5.0% higher than the equivalent period of 2017 and remains 4.3% higher than the start of 2018.
Meanwhile, European exports on the index remained almost unchanged on the previous month, increasing by just 0.6% to 110.07. Although the exports benchmark is 0.2% lower than Dec-17, it is up 0.3 % since the start of the year.
XSI ™ - Far East Imports / Exports Indices
The Far East Imports XSI ™ fell 3.3% in Dec-18 to 109.96 points as its continued demise shows no signs of abating. Since its high of 135.43 recorded in Nov-17, it has fallen by 18.8%. Year-to-date the benchmark is down 16.3% and it is 18.4% lower than the same period of 2017.
Far East exports also witnessed a substantial month-on-month fall, declining by 4.5% to 116.23. The benchmark is now just 0.7% higher than the same period a year earlier and is up just 1.3% since the start of the year.
XSI ™ - US Imports / Exports Indices
The XSI ™ for US imports declined 5.7% in Dec-18 to 101.60 points, thereby negating most of the 6.4% increase recorded in the previous month. The decline follows on from falls reported in the spot market, as the demand relating to shippers seeking to fulfill imports prior to further tariffs begins to wane.
US exports on the XSI ™ also declined, albeit less aggressively, falling 0.2% month-on-month to 87.53. Although the fall was minimal, the benchmark is now down 7.1% year-to-date and is 7.8% lower than the same period of 2017.
###
Don't miss out! Get your copy of the monthly Xeneta Shipping Index Public report now.